
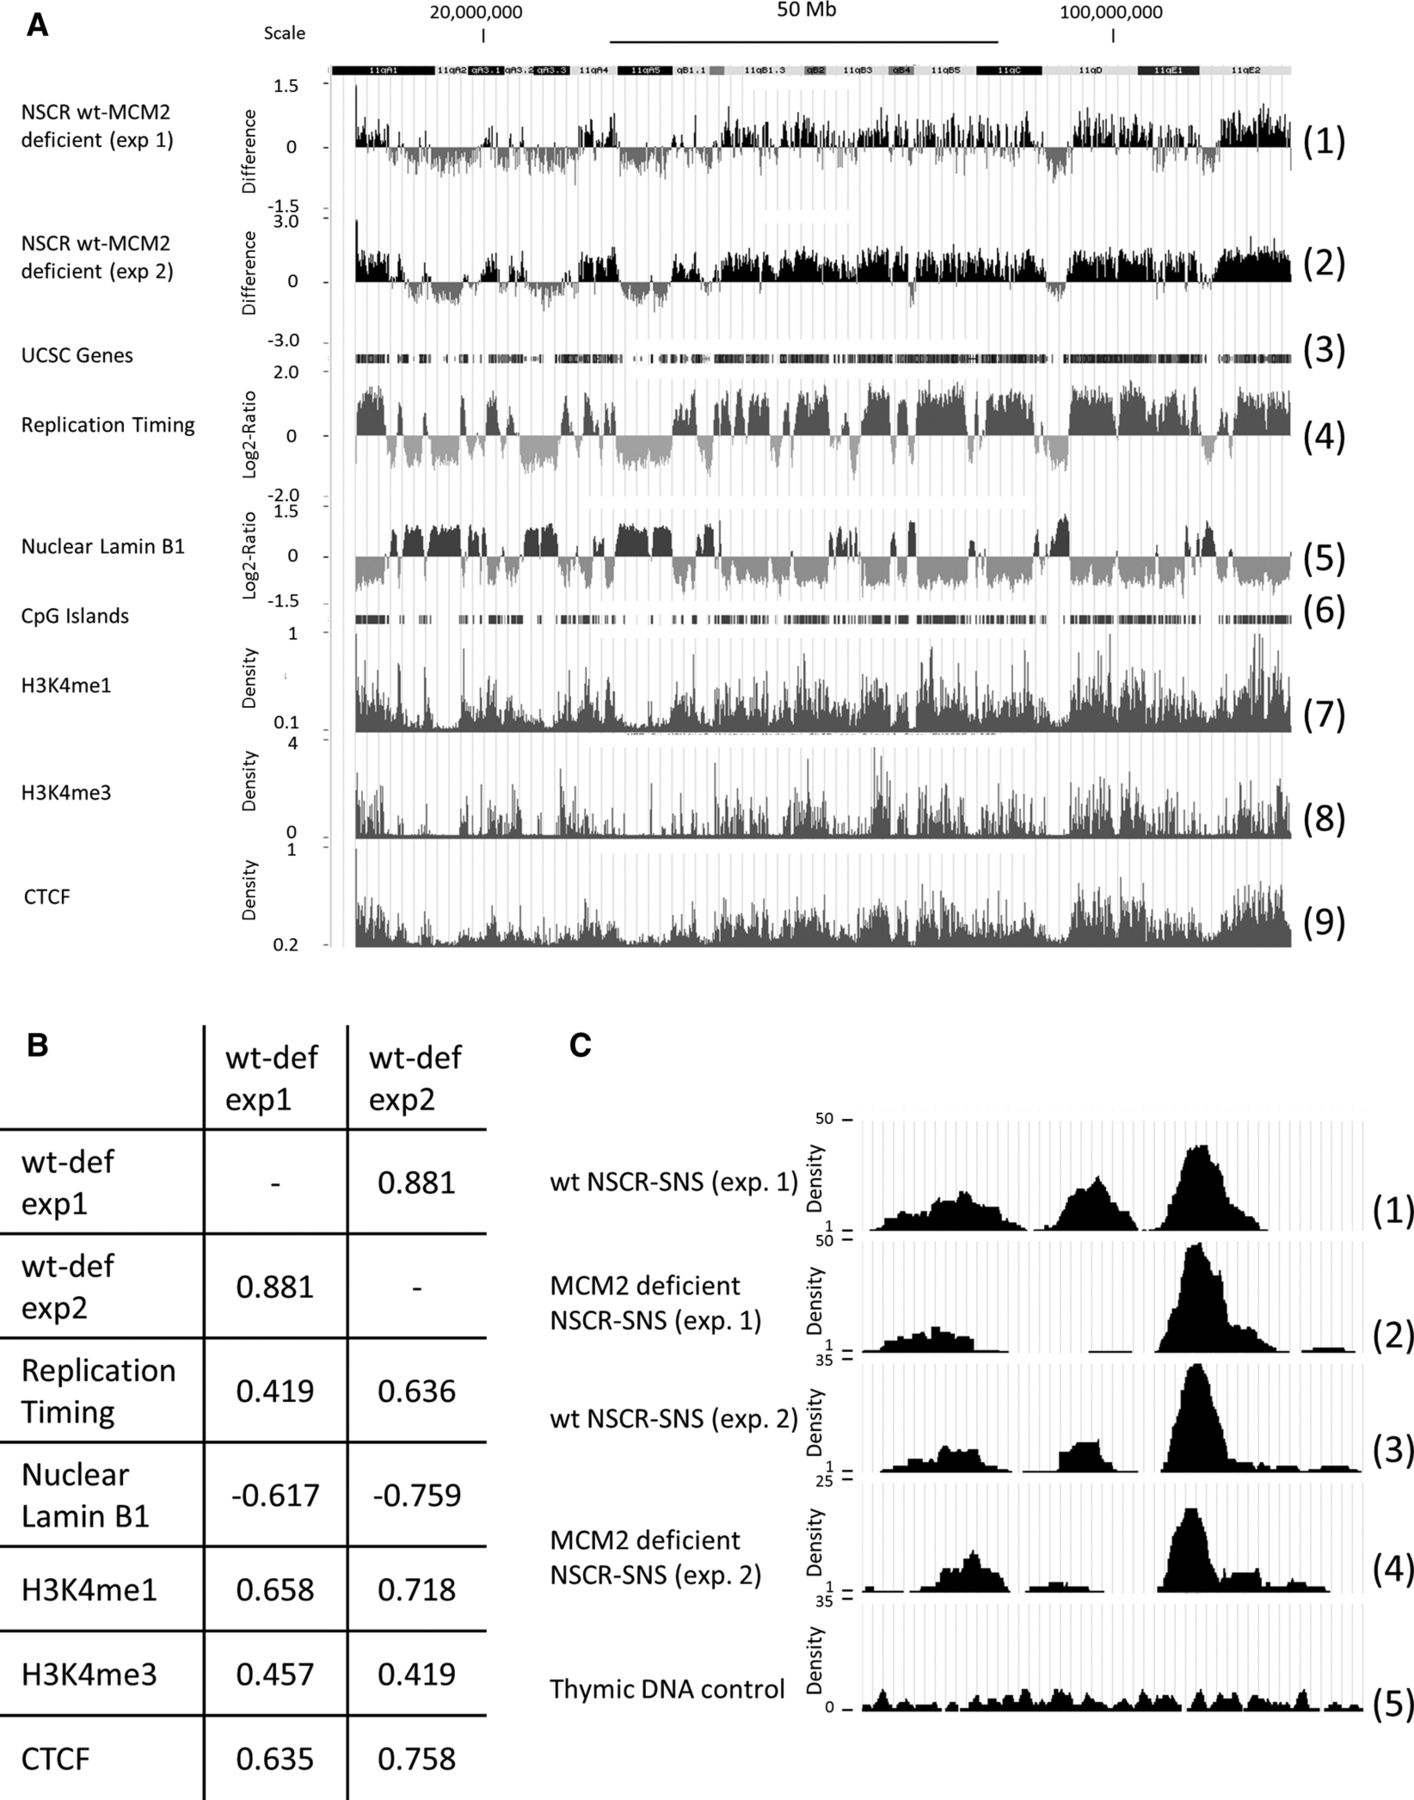
Effect of MCM2 deficiency on nascent strand density. (A) All of Chr 11 (assembly mm9) with scale and chromosome band above the tracks. (1) Wt-deficient difference for exp. 1; (2) wt-deficient difference for exp. 2; (3) UCSC gene density; (4) replication timing (FSU repli-ChIP for MEF; The ENCODE Project Consortium 2012, FSU ENCODE group); (5) lamin B1 (NKI nuclear lamina, lamin B1 for MEF; Peric-Hupkes et al. 2010); (6) CpG island density; (7) H3K4me1 (LICR histone H3K4me1 for MEF; The ENCODE Project Consortium 2012, Ren Laboratory); (8) H3K4me3 (LICR histone H3K4me3 for MEF; The ENCODE Project Consortium 2012, Ren Laboratory); (9) CTCF (LICR TFBS CTCF for MEF; The ENCODE Project Consortium 2012, Ren Laboratory). (B) Correlation coefficients between different tracks calculated using the UCSC Table Browser for Chr 11 as indicated in the figure. C shows a ∼2-kbp region from Chr 10 where (1) is wt exp. 1; (2) is MCM2-deficient exp. 1; (3) is wt exp. 2; (4) is MCM2-deficient exp. 2; and (5) is total thymic DNA for the same region (control).


