
Figure 5.
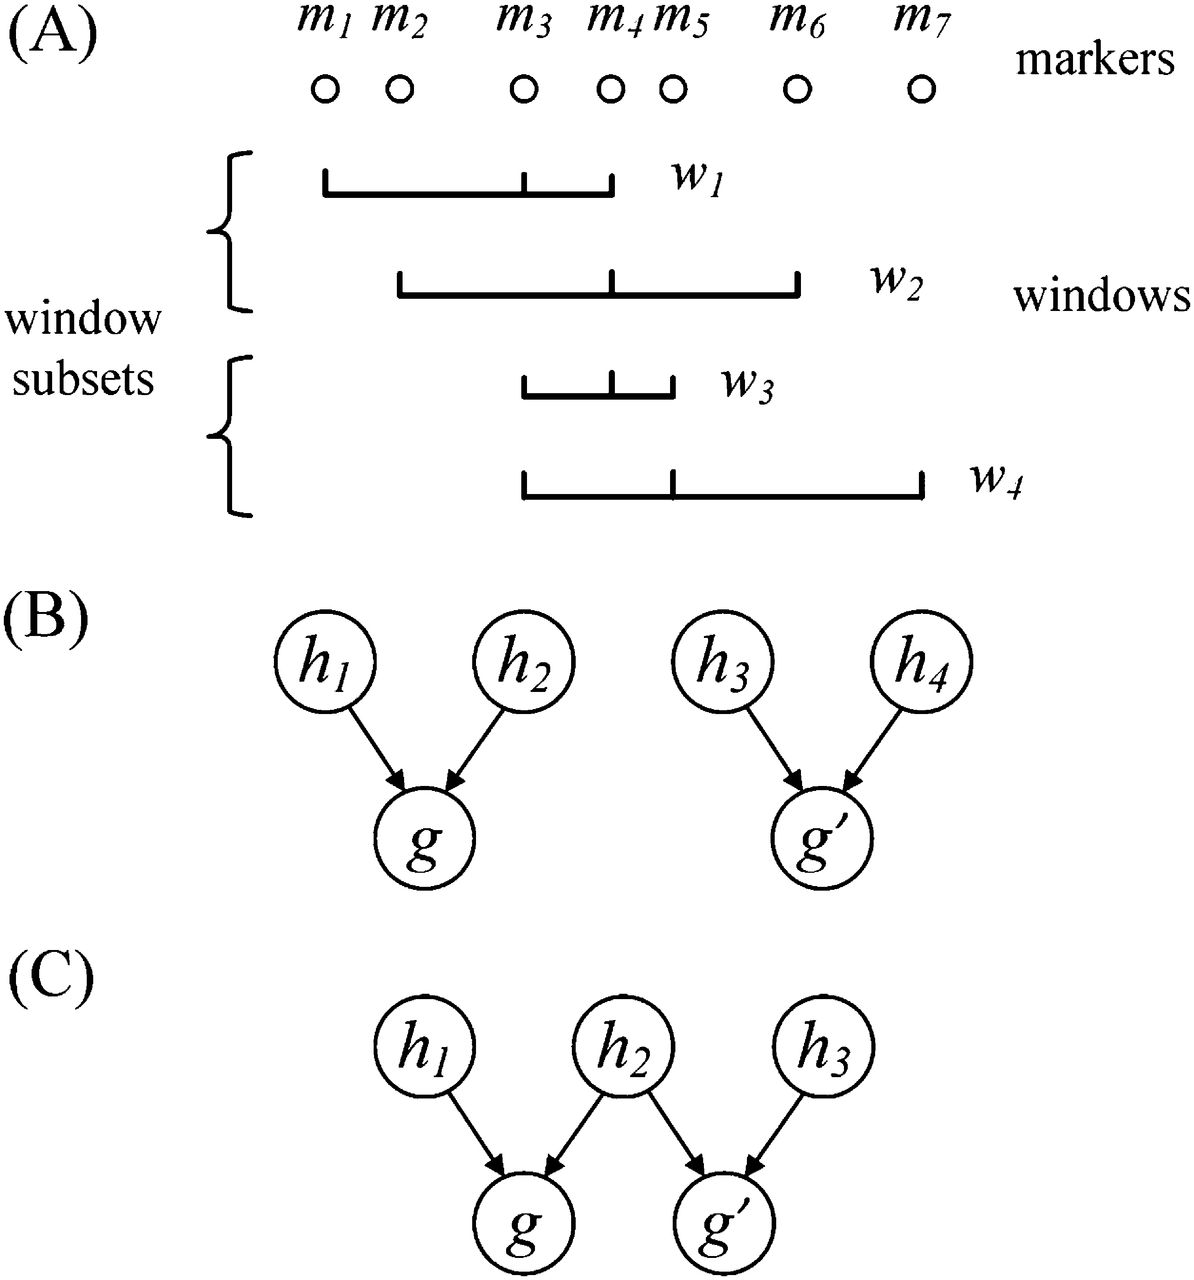
(A) Example of windows and window subsets. Here, windows contain three markers and window subsets contain two windows. (B,C) Graphical models used for the inner log-likelihood ratio described in Equation 2. (B) Model for two unrelated individuals that do not share an IBD segment in the window. (C) Model for two related individuals sharing a single IBD segment in the window. The variables  and
and  represent hidden haplotypes for a given window of markers. The variables g and g′ represent the observed genotype vectors from the first and second individual in a pair of individuals being evaluated for
IBD in the window.
represent hidden haplotypes for a given window of markers. The variables g and g′ represent the observed genotype vectors from the first and second individual in a pair of individuals being evaluated for
IBD in the window.


