
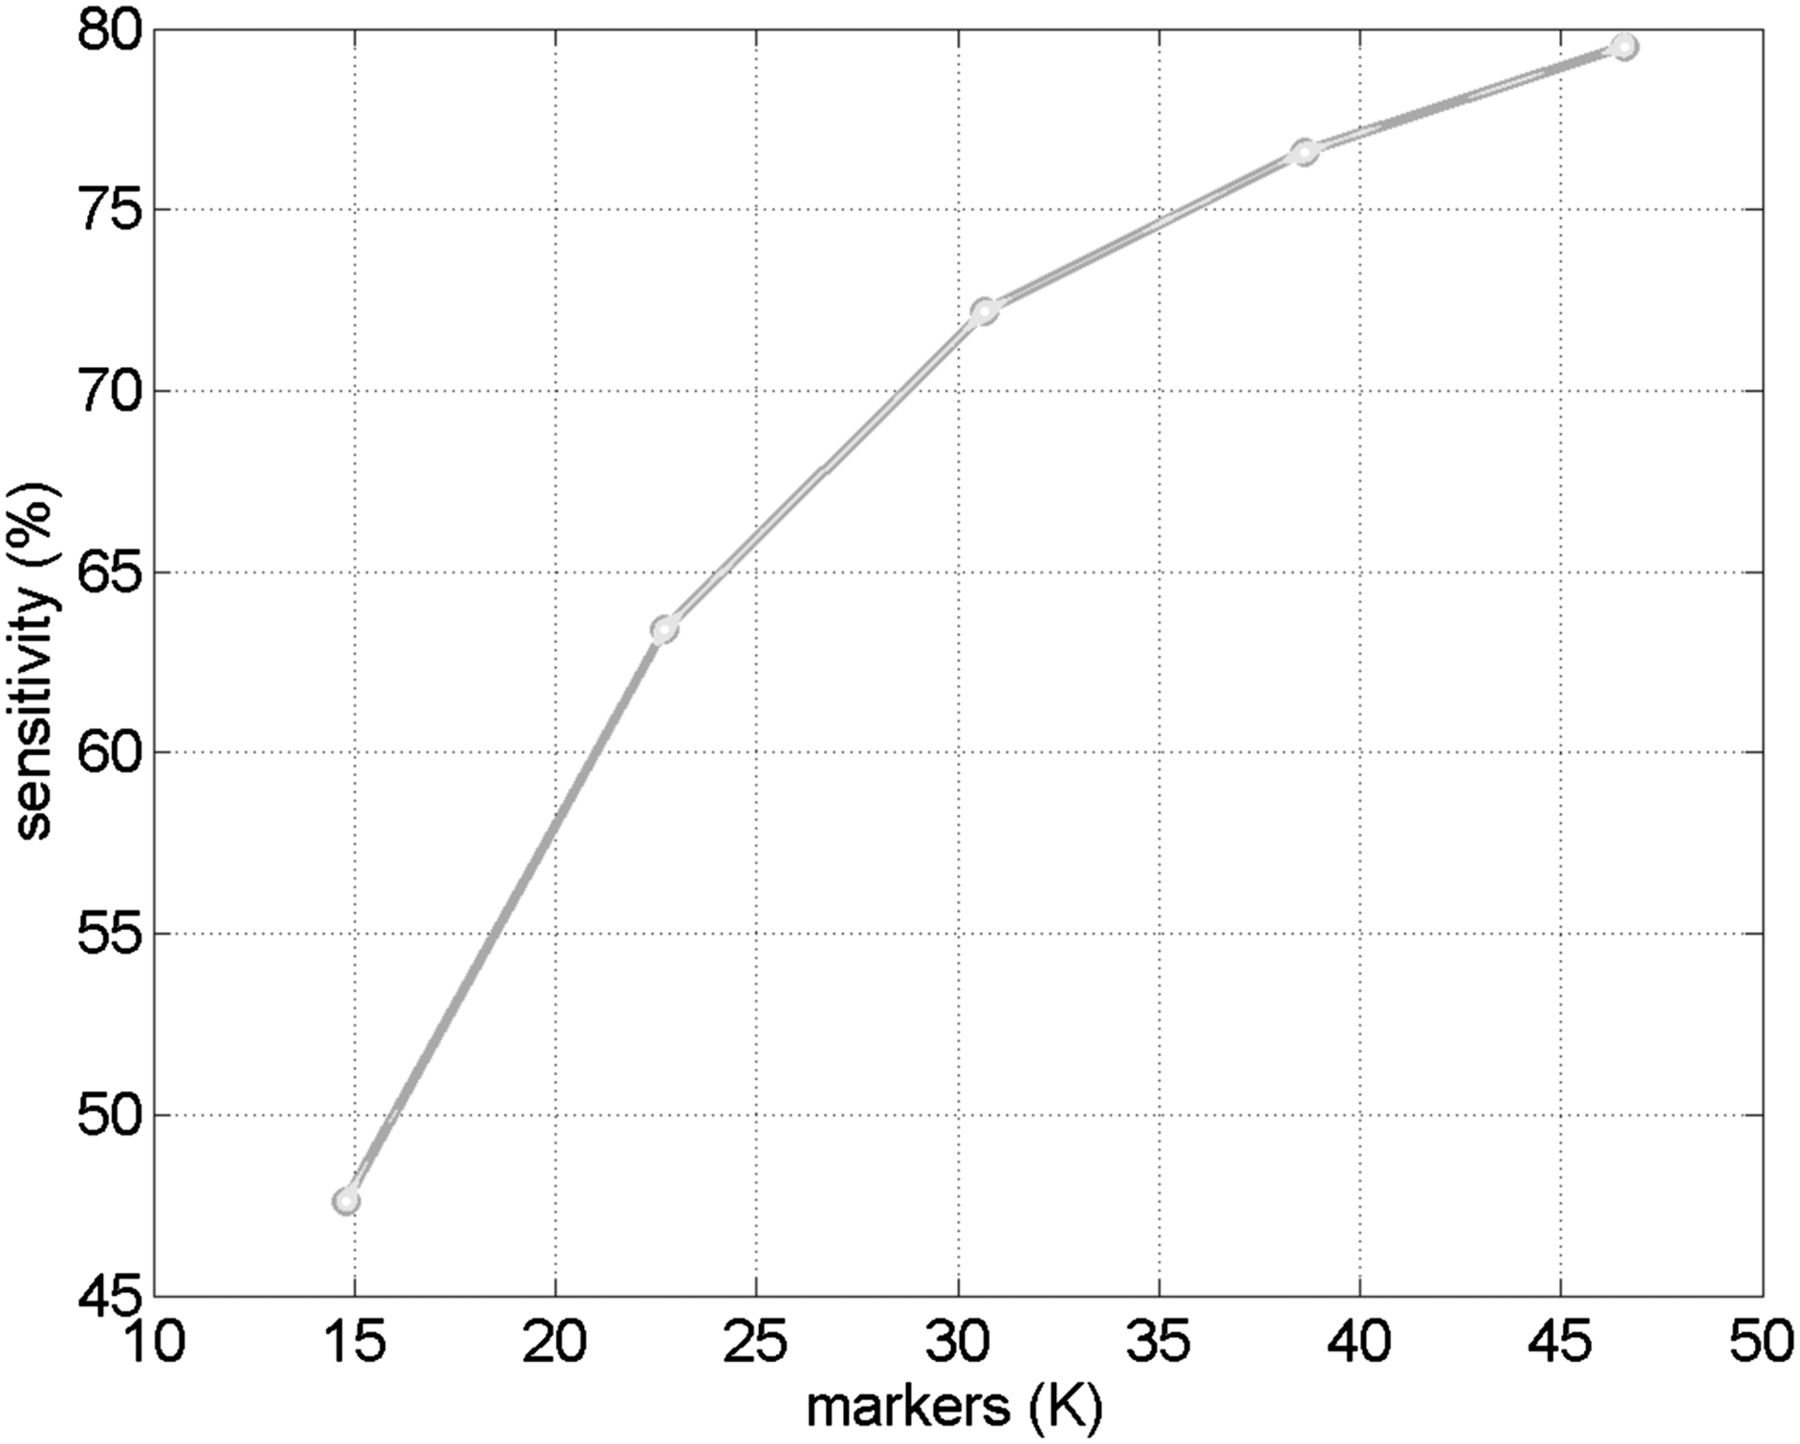
Figure 3.
Performance of Parente2 as a function of marker density. Parente2 performance is shown as a function of marker density; tests are performed on the HapMap-2cM benchmark with FPR fixed at 1%.
(Downloading may take up to 30 seconds. If the slide opens in your browser, select File -> Save As to save it.)
Click on image to view larger version.
Performance of Parente2 as a function of marker density. Parente2 performance is shown as a function of marker density; tests are performed on the HapMap-2cM benchmark with FPR fixed at 1%.
 CiteULike
 Delicious
 Digg
Digg Facebook
 Google+
 Reddit
 Twitter
