
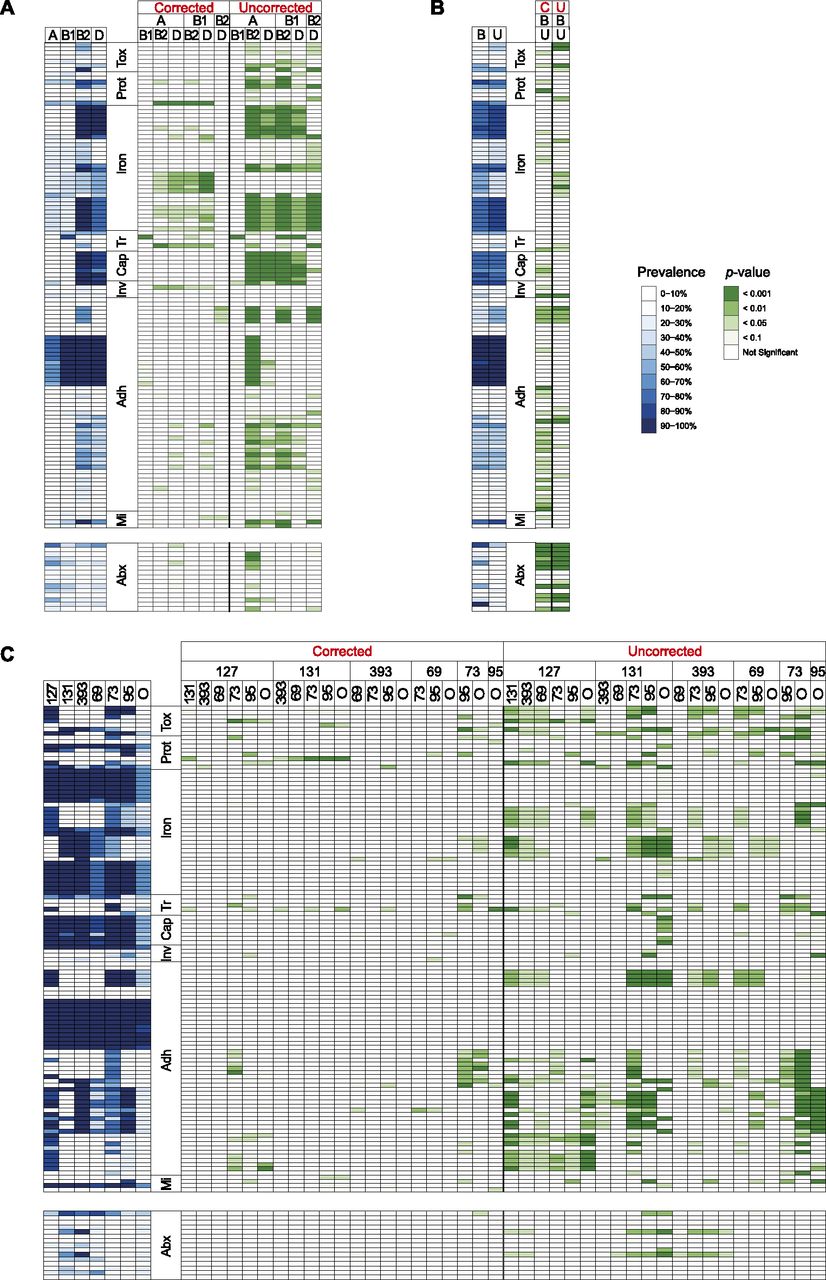
Proportion and relative enrichment of virulence factors and antibiotic resistance phenotypes carried by isolates in distinct groups. Rows correspond to individual VFs (top) or antibiotic resistance phenotypes (Abx, bottom). VFs are grouped by class. (Tox) toxin, (Prot) protectin, (Iron) iron metabolism, (Tr) transporter, (Cap) capsule, (Inv) invasion, (Adh) adhesion, (Mi) miscellaneous. Columns correspond to categories of isolates grouped according to different classification schemes. Prevalence of factors within each category is shown at left for each panel (blue heatmap). Raw P-values from all possible pairwise comparisons of factor prevalence between them is shown at right for each panel (green heatmap), with the specific pairwise comparison indicated above each column. P-values were obtained after correcting for inferred population structure (left, labeled in red with “Corrected” or “C”) or without such correction (right, labeled in red “Uncorrected” or “U”). (A) Comparison of E. coli phylogroups. (B) Comparison of isolates obtained from blood (B) and urine (U). (C) Comparison of the six most prevalent MLST groups (sequence type numbers are indicated) and a seventh category encompassing all other MLST groups (“O”).


