
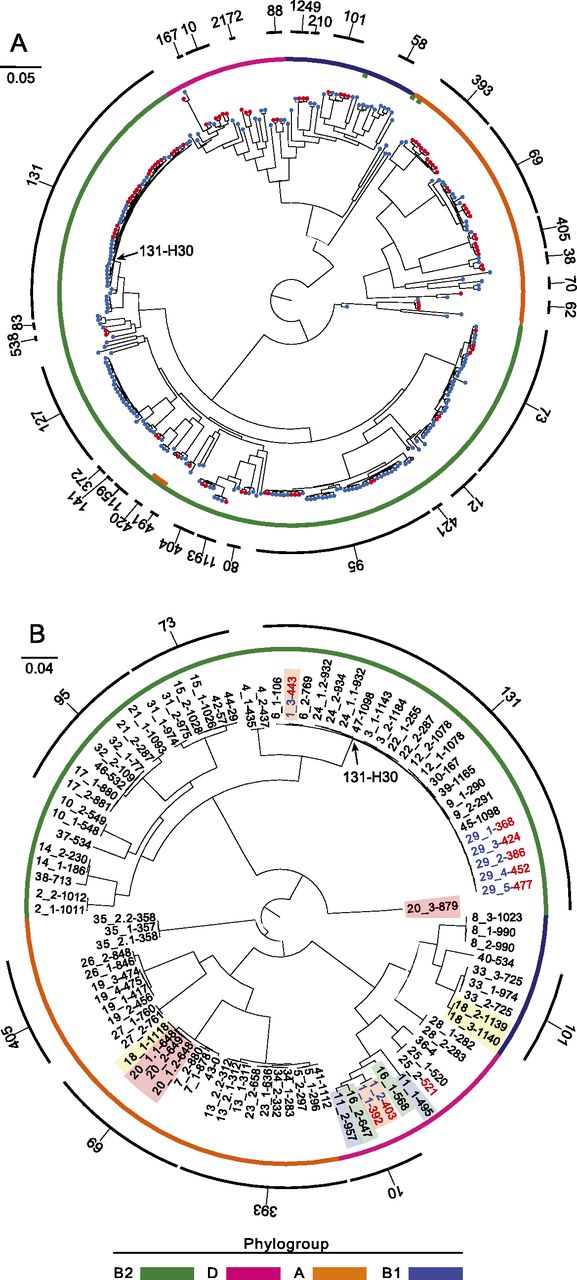
Whole-genome phylogenetic tree of ExPEC E. coli isolates. (A) Approximate maximum likelihood phylogeny showing the population structure of ExPEC E. coli. Isolates cultured from blood are represented as red terminal nodes and those cultured from urine are shown in blue. Colored ring denotes annotation of major E. coli phylogroups. Seven isolates assigned to phylogroups that are inconsistent with their phylogenomic placement are indicated with colored bars internal to this ring. The outermost ring (black) indicates groups of MLST sequence types. Sequence types with at least two representatives are numbered. The group corresponding to subclone S131-H30 is indicated. (B) Approximate maximum likelihood phylogeny of blood isolates only. Isolates are labeled according to the patient of origin and the relative day of collection (in red, ranging from day 0 for patient 43 to day 1184 for patient isolate 3_2). In instances where multiple isolates were obtained from the same patient, the order in which specimens were recovered is indicated by an underscore and a number. Patients for which multiple, genomically distinct strains were identified are highlighted. Isolates from patients 1 and 29 are indicated by blue text. The group corresponding to subclone ST131-H30 is indicated. Colored ring as in A. Scale bars are expressed in changes per site for both panels.


