
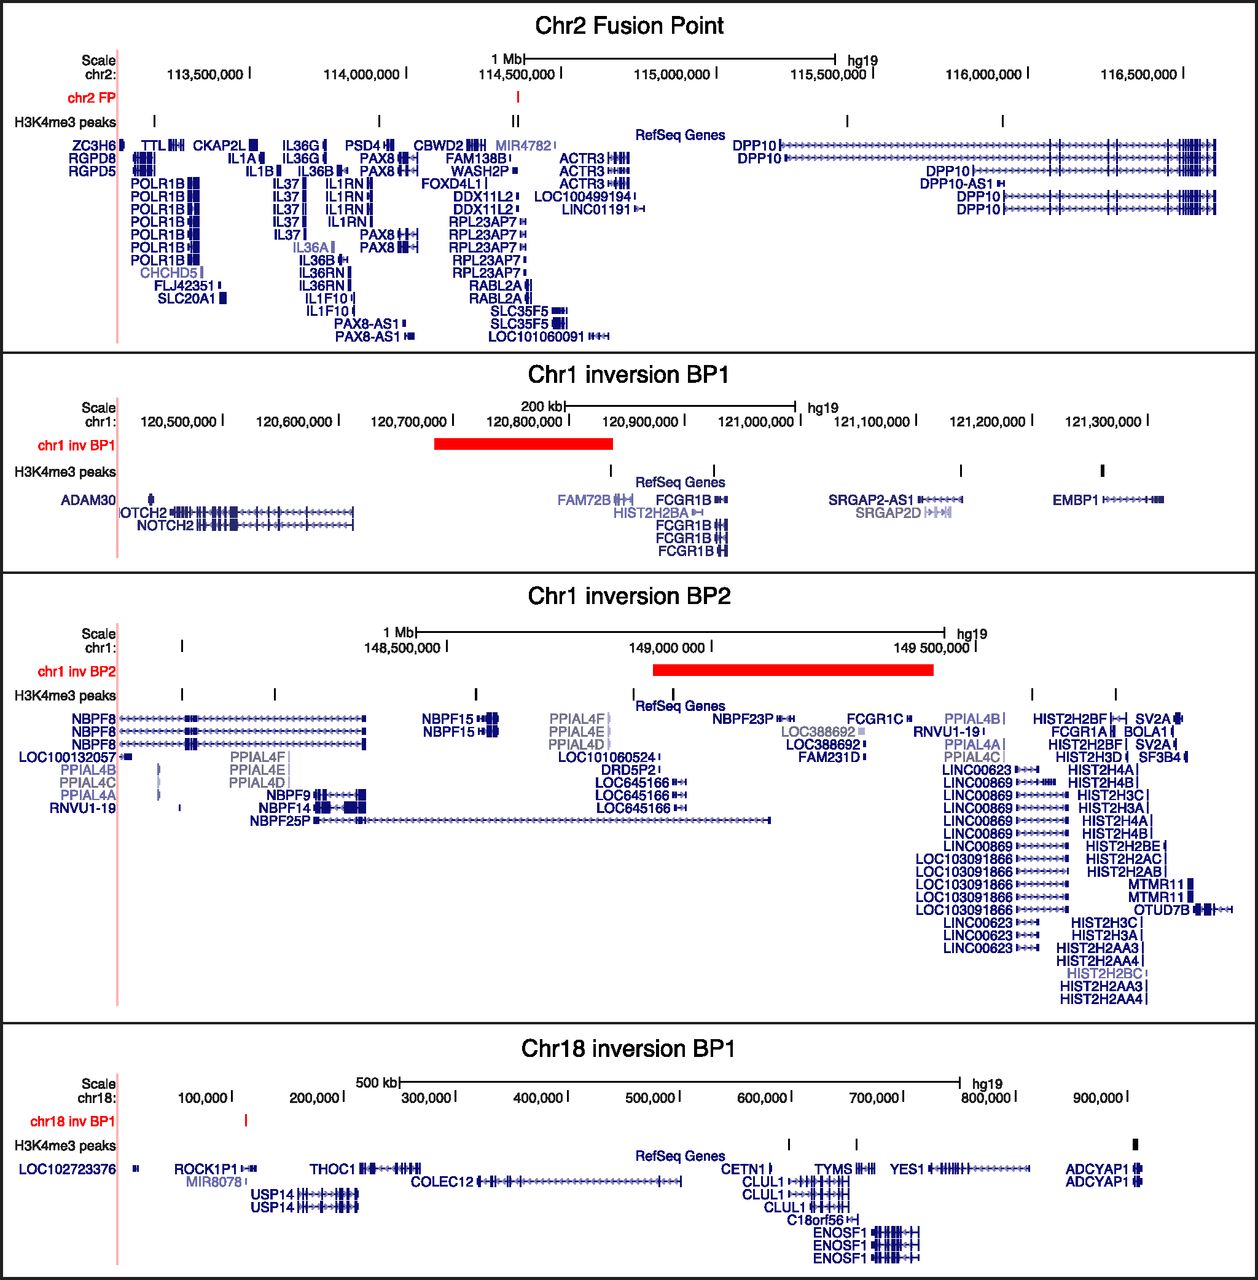
Figure 3.
Localization of human specifically enriched H3K4me3 peaks in prefrontal cortex that map in the proximity of the HSA2 fusion point (n = 6; top panel), HSA1 inversion breakpoints (n = 4 and 7, respectively, for BP1 and BP2; center panels), and HSA18 inversion breakpoint 1 (n = 3; bottom panel). The human-specific H3K4me3 peaks indicated by black vertical ticks and the position of the break- and fusion points marked in red are shown together with the genes mapping within these regions (blue).


