
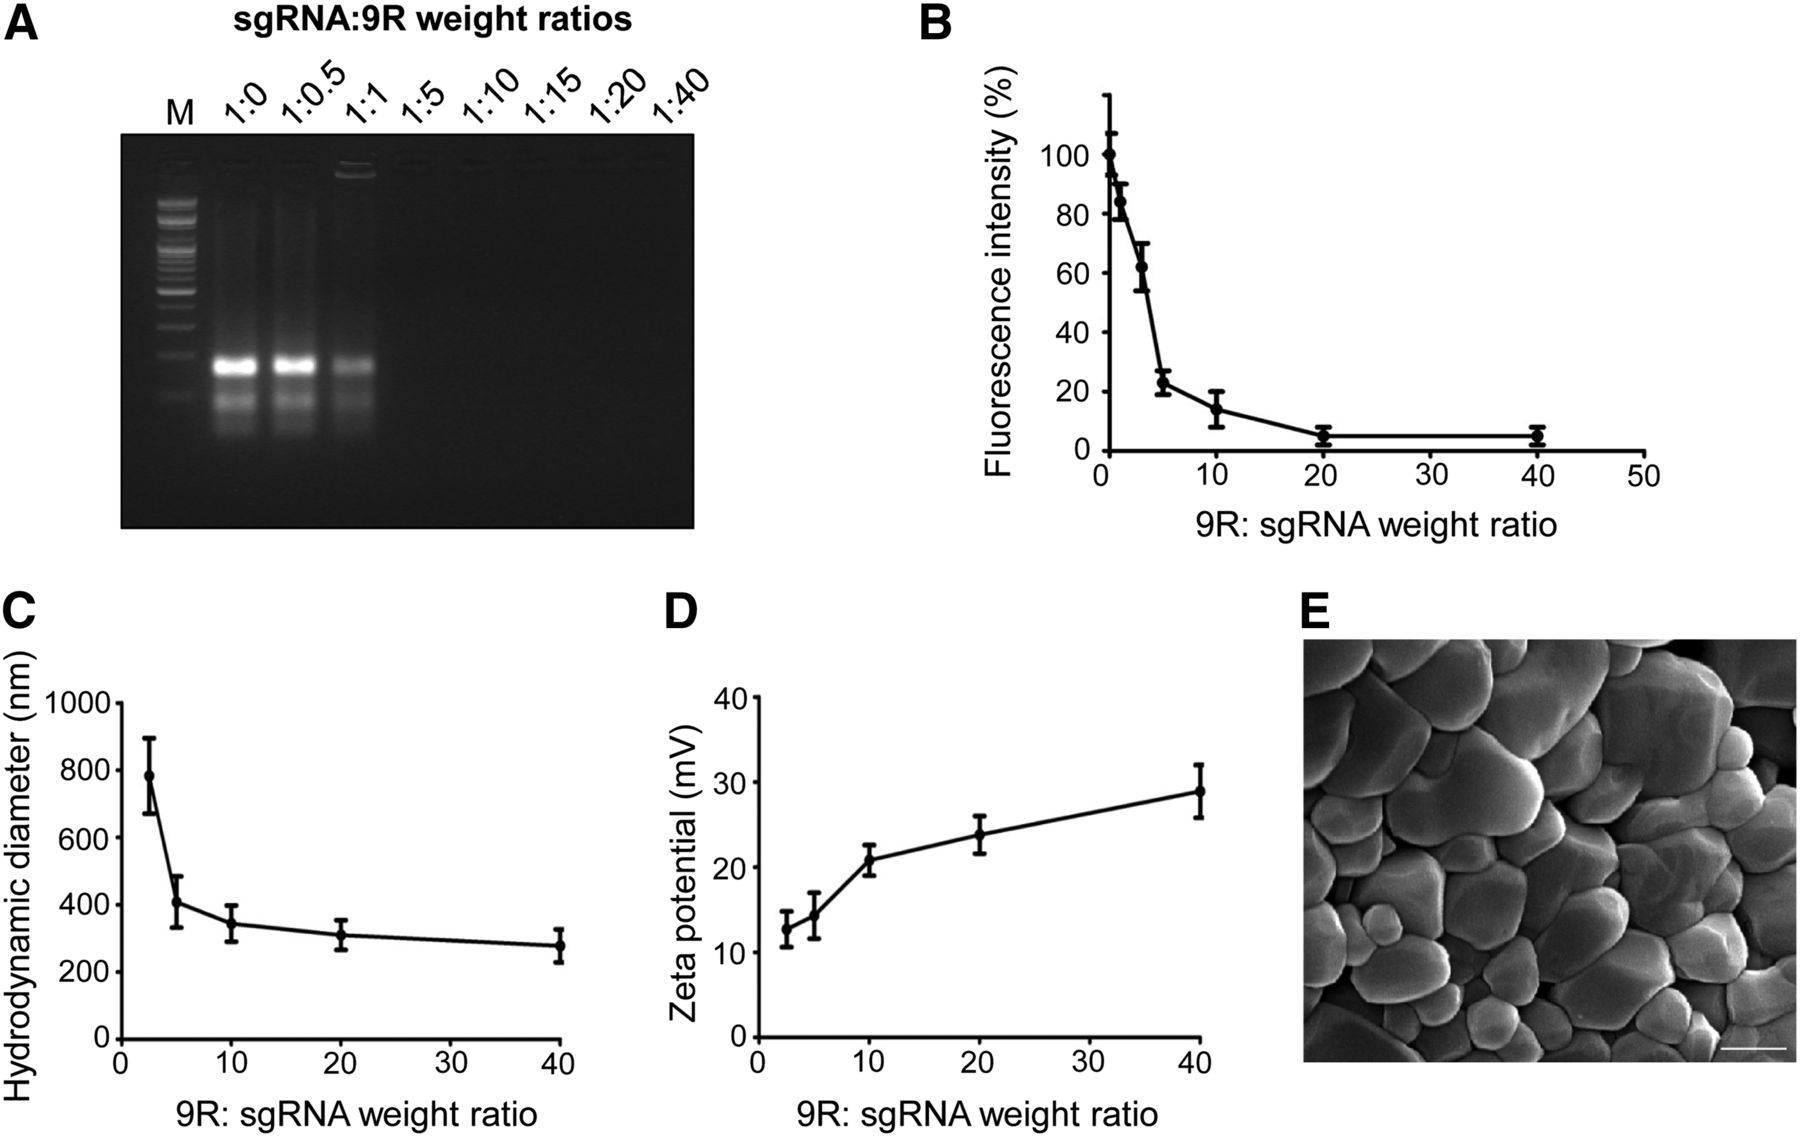
Physiochemical characterization of the sgRNA:9R complex. (A–D) A constant amount of sgRNA was complexed with various amounts of 9R. (A) Electrophoretic mobility shift assay. sgRNA was complexed with 9R at various weight ratios and subjected to electrophoresis. (B) Ethidium bromide (EtBr) exclusion assay. The reduction in EtBr fluorescence of sgRNA by complex formation with 9R at various weight ratios was measured. The relative fluorescence intensity is expressed as the percentage of the fluorescence of the uncomplexed sgRNA–EtBr sample. Data represent the average ± SD (n = 3). (C,D) Particle size distribution (C) and surface charge distribution (D) of the complex at different 9R:sgRNA weight ratios were determined using dynamic light scattering (DLS). Data represent the average ± SD (n = 3). (E) Representative scanning electron microscopic image of sgRNA:9R nanoparticles. Scale bar, 500 nm.


