
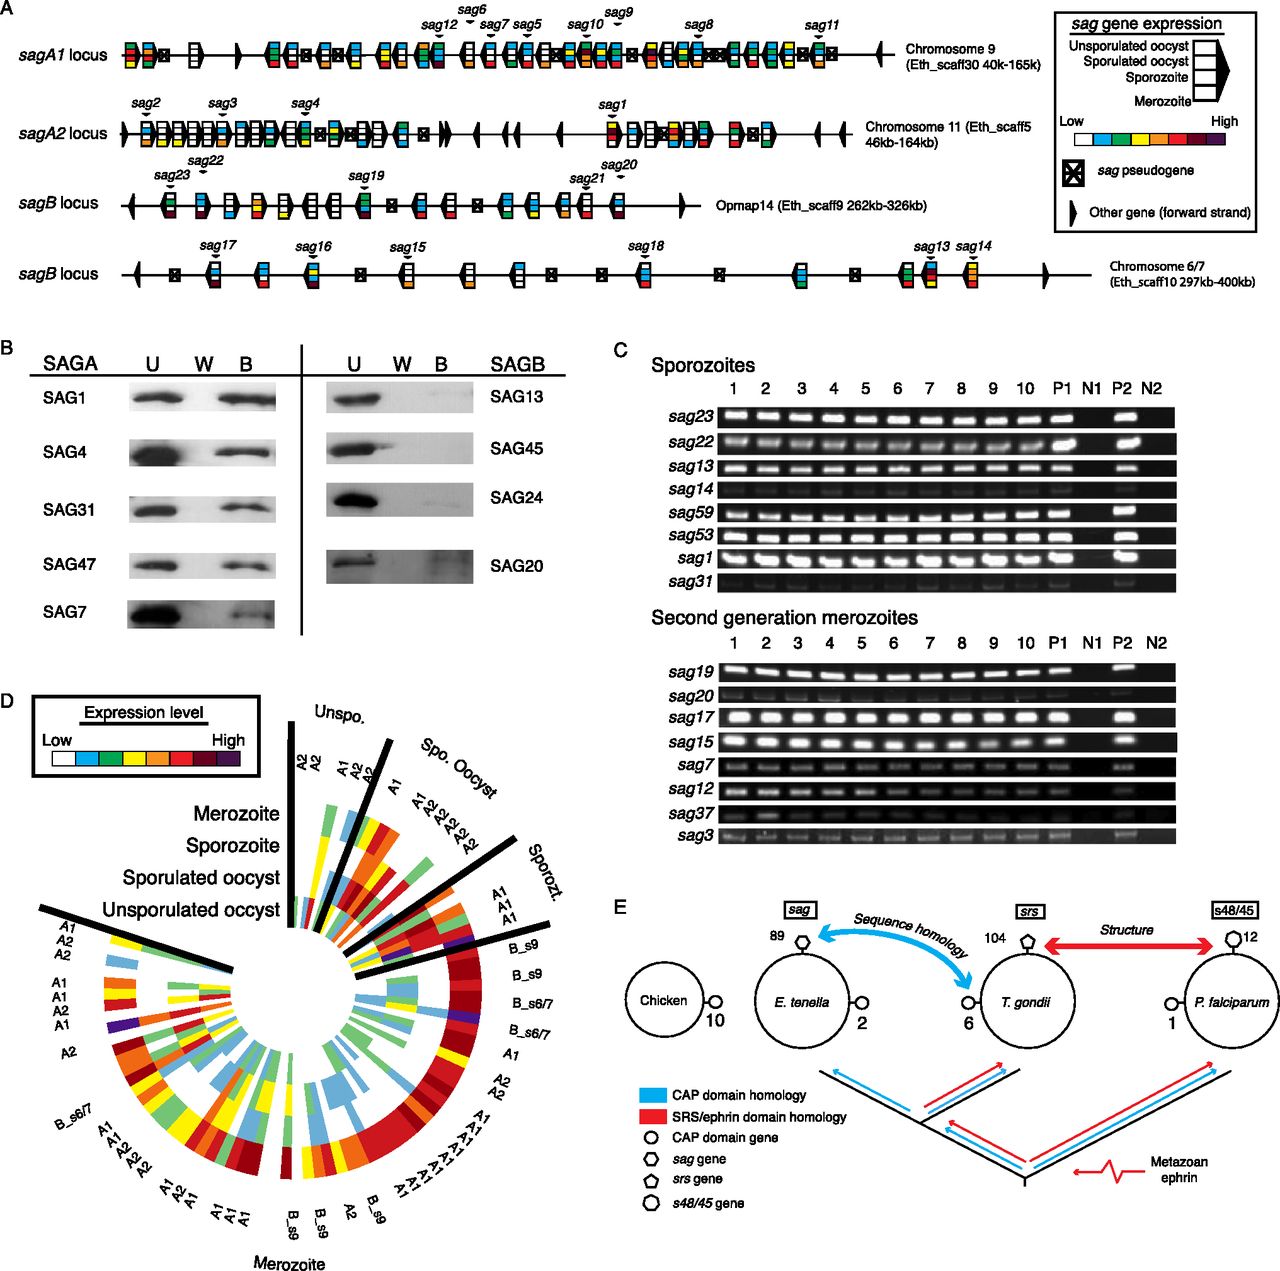
Analysis of the principle family of surface antigens in Eimeria spp. (A) The four loci of tandemly repeated sag genes in E. tenella are shown with each sag gene represented by bars describing the relative expression levels in four stages of the lifecycle. Gene names used previously in the literature are shown where appropriate. Arrows indicate direction of transcription. (B) We found that, of those tested, SAG proteins from subfamily A bound host cells, but those from family B did not. (U) Unwashed; (W) washed; (B) bound. (C) Expression of multiple sag genes in individual cells of E. tenella was detected using RT-PCR. Ten cells were analyzed for each of eight genes in both sporozoites and second-generation merozoites. (Lanes 1–10) Single-cell multiplex test RT-PCRs. Controls: (lane P1) positive, cDNA library multiplex RT-PCR; (lane N1) negative, no template multiplex RT-PCR; (lane P2) positive, single sporozoite, single target RT-PCR; (lane N2) negative, single sporozoite, single target PCR with no RT. (D) Expression values for all E. tenella sag genes were clustered and those clusters ordered by mean peak expression, showing that most genes peak in the second-generation merozoite. Where appropriate, genes are annotated with their genomic locus as defined in A. (E) Patterns of homology for Eimeria sag and Toxoplasma srs genes suggest that while Toxoplasma acquired the precursors to its key family of 6-cys surface antigens from a horizontal gene transfer of metazoan ephrin, Eimeria has derived them from the cysteine-rich secretory proteins, antigen 5, and pathogenesis-related 1 protein (CAP) family already found in Apicomplexa. Thin, single-headed arrows show phylogenetic paths for CAP- and ephrin-related domains, while bold arrows show the best evidence for the closest relatives of the sag and srs families. Numbers indicate gene frequencies for each family.


