
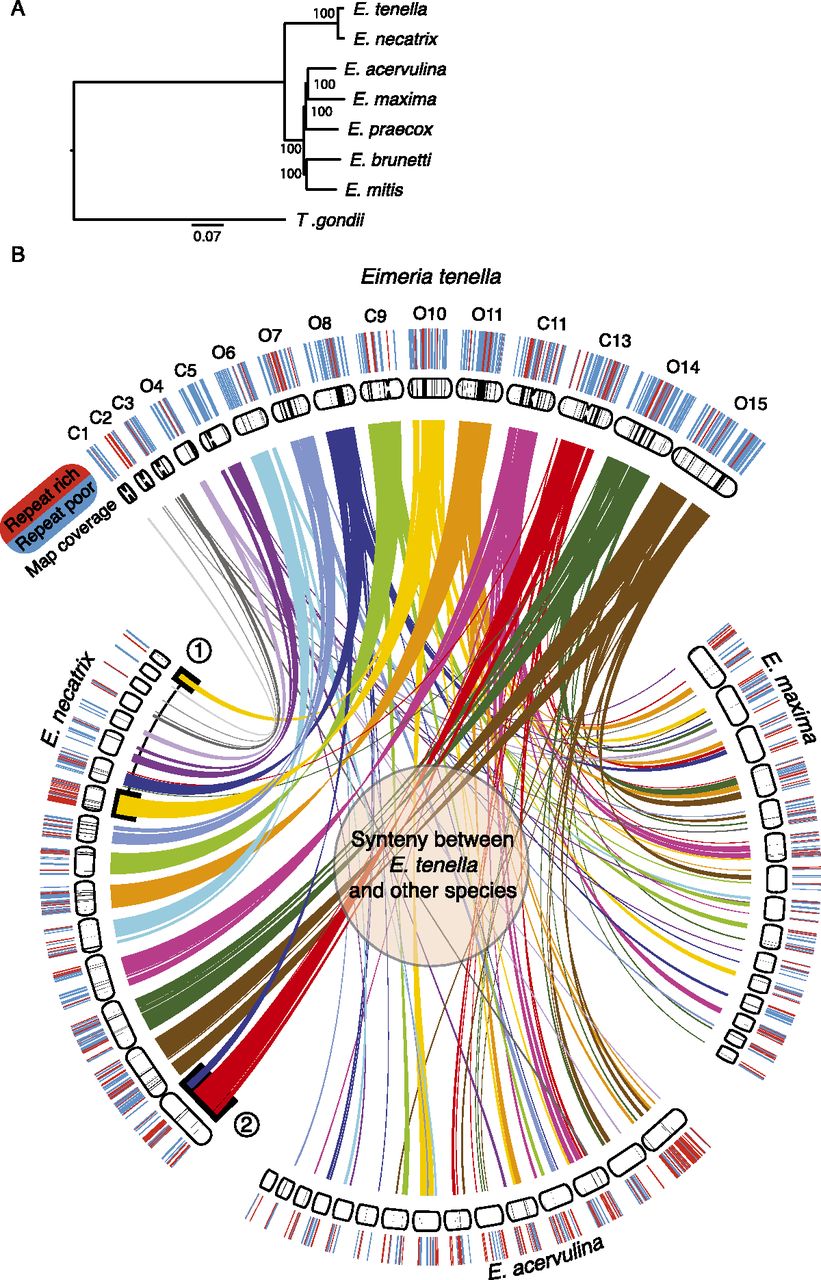
Whole-genome phylogeny and synteny between Eimeria species. (A) Maximum likelihood phylogeny showing the evolutionary relationships between Eimeria species based on alignment of 814 one-to-one orthologs shared with T. gondii. The scale is in substitutions per site. (B) Genomic scaffolds were placed onto optical maps. Black bands show map coverage. Coverage was noticeably better for E. tenella than the tier 2 species. E. tenella maps are named as chromosomes (e.g., C1) where it was possible to reliably identify that chromosome, otherwise they are given their optical map numbers (e.g., O4). Each E. tenella map has been assigned a color and ribbons highlight syntenic regions in the related genomes. E. necatrix is most closely related to E. tenella and correspondingly shows the greatest degree of synteny. The clearest exceptions are (1) O10, which is split between two optical contigs in E. necatrix, and (2) O8, which is similarly split. Map coverage is lower in E. acervulina and E. maxima and this gives the impression that there is a great deal of novel sequence in these species. However, this is largely the result of differential representation of the genomes in their respective maps. Each map is annotated with repeat-poor (blue) and repeat-rich (red) regions ≥30 kb. This highlights the barcode-like patterning across the whole of each genome.


