
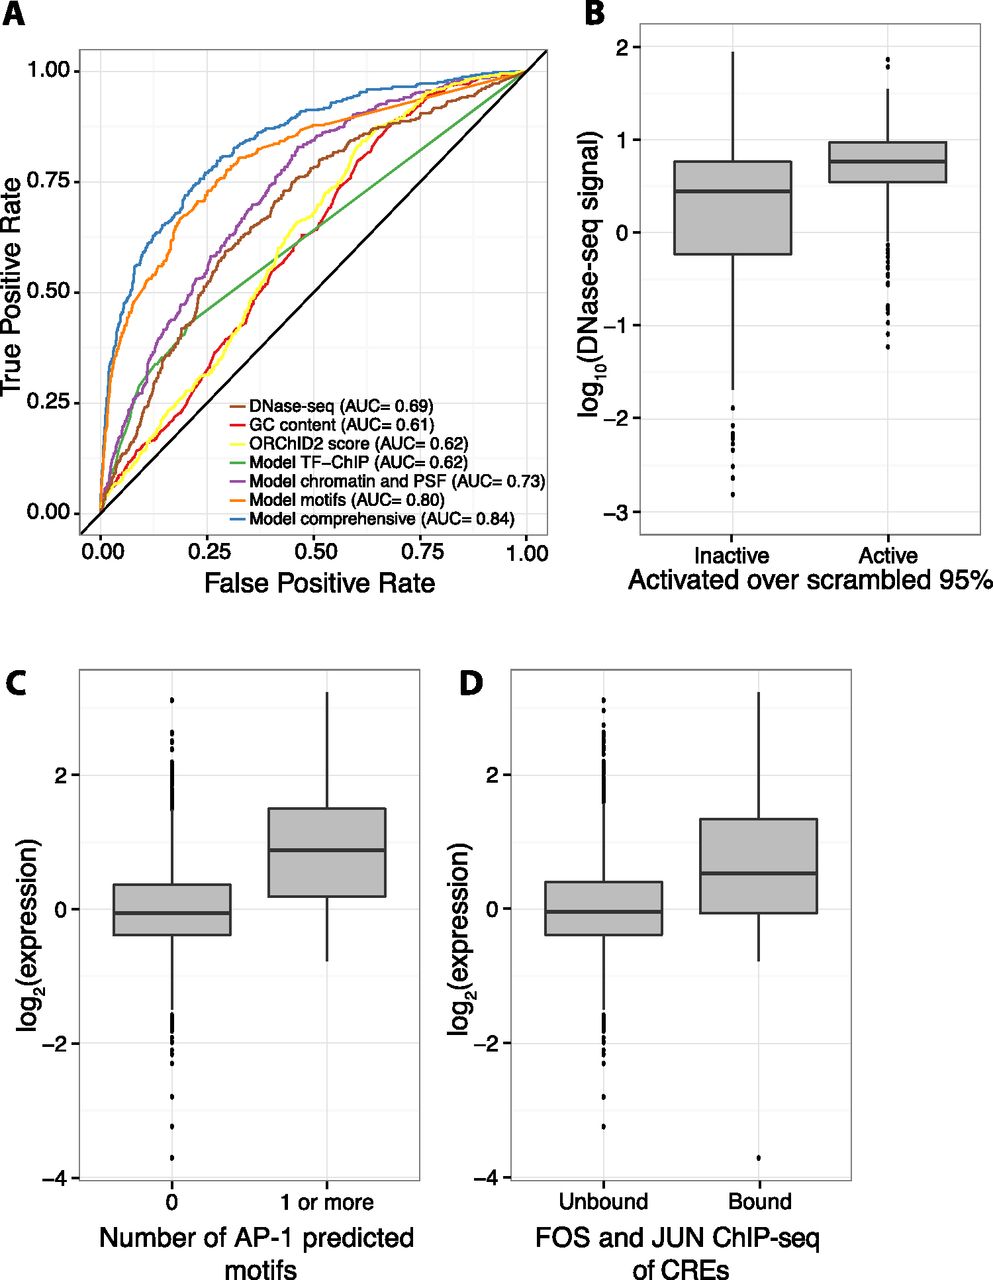
Chromatin features and sequence-specific binding identify active sequences. (A) Receiver operating characteristic (ROC) curve shows that a logistic regression model (“Model comprehensive”) incorporating sequence-specific binding motifs, chromatin features, primary sequence features (PSFs), and TF-ChIP data is best able to identify active sequences. Of logistic regression models with fewer features, one with sequence-specific binding motifs (“Model motifs”) does best, followed by a model incorporating chromatin and primary sequence features (“Model chromatin and PSF”), and a model with only significant TF-ChIP features (“Model TF-ChIP”). Minor groove width as predicted by ORChID2 score, GC content, and DNase I HS are also shown. Area under the curve (AUC) is indicated in legend. (B) Boxplot showing that active CREs are enriched in high DNase I HS signal over inactive CREs. (C) Boxplot showing that CREs with at least one predicted AP-1 motif drive expression higher than CREs with no AP-1 predicted motifs. (D) CREs overlapping with ChIP-seq peaks for a FOS (FOS or FOSL1) family member and a JUN (JUNB or JUND) family member, the constituent proteins of AP-1, drive expression higher than unbound CREs.


