
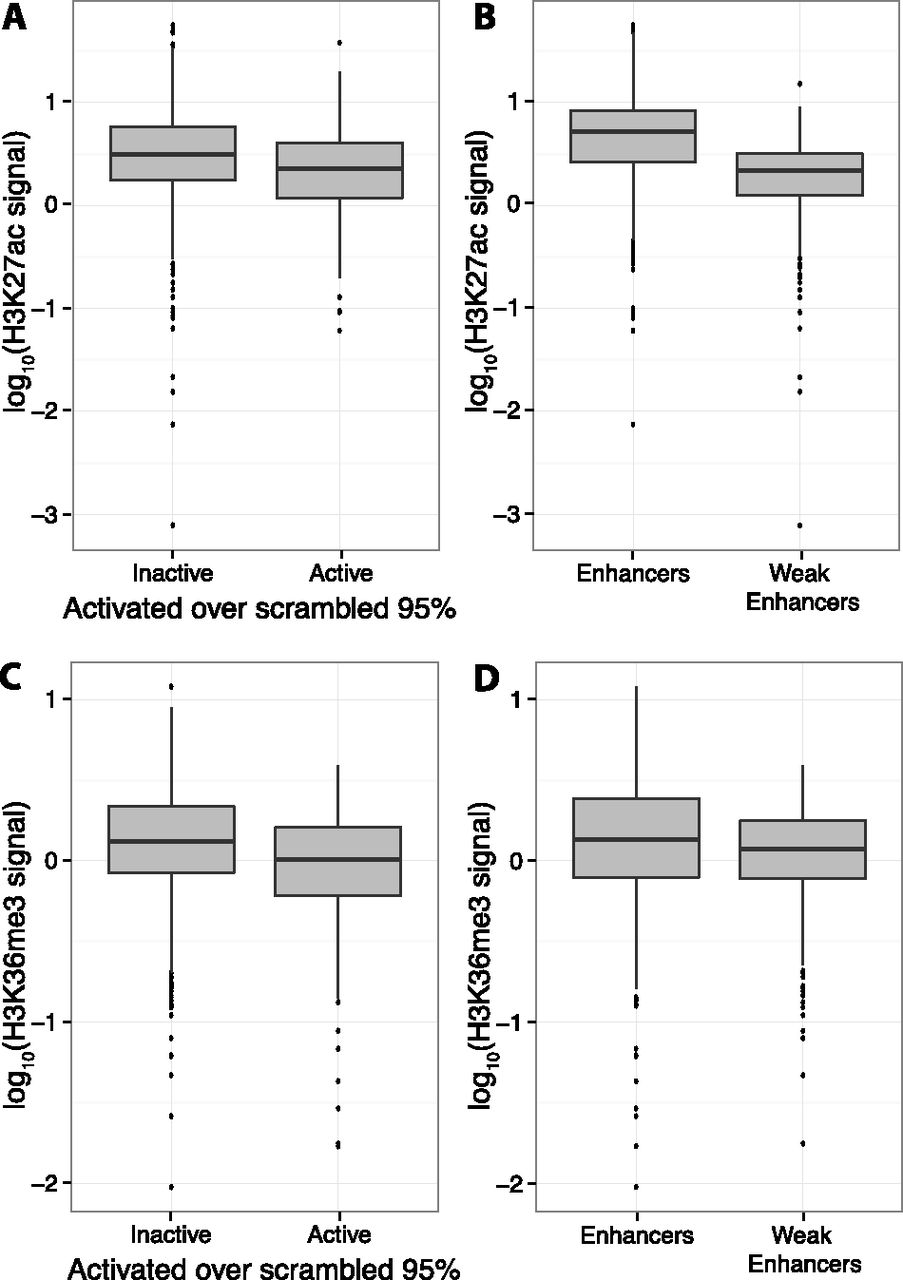
Figure 2.
Lower H3K27ac and H3K36me3 signals are associated with higher Weak Enhancer expression. Boxplots showing that H3K27ac signal (A) and H3K36me3 signal (C) are depleted in active CREs compared to inactive CREs. H3K27ac signal (B) and H3K36me3 signal (D) are also depleted in Weak Enhancers compared to Enhancers. Active CREs are those above the 95th percentile of scrambled distribution (Table 1).


