
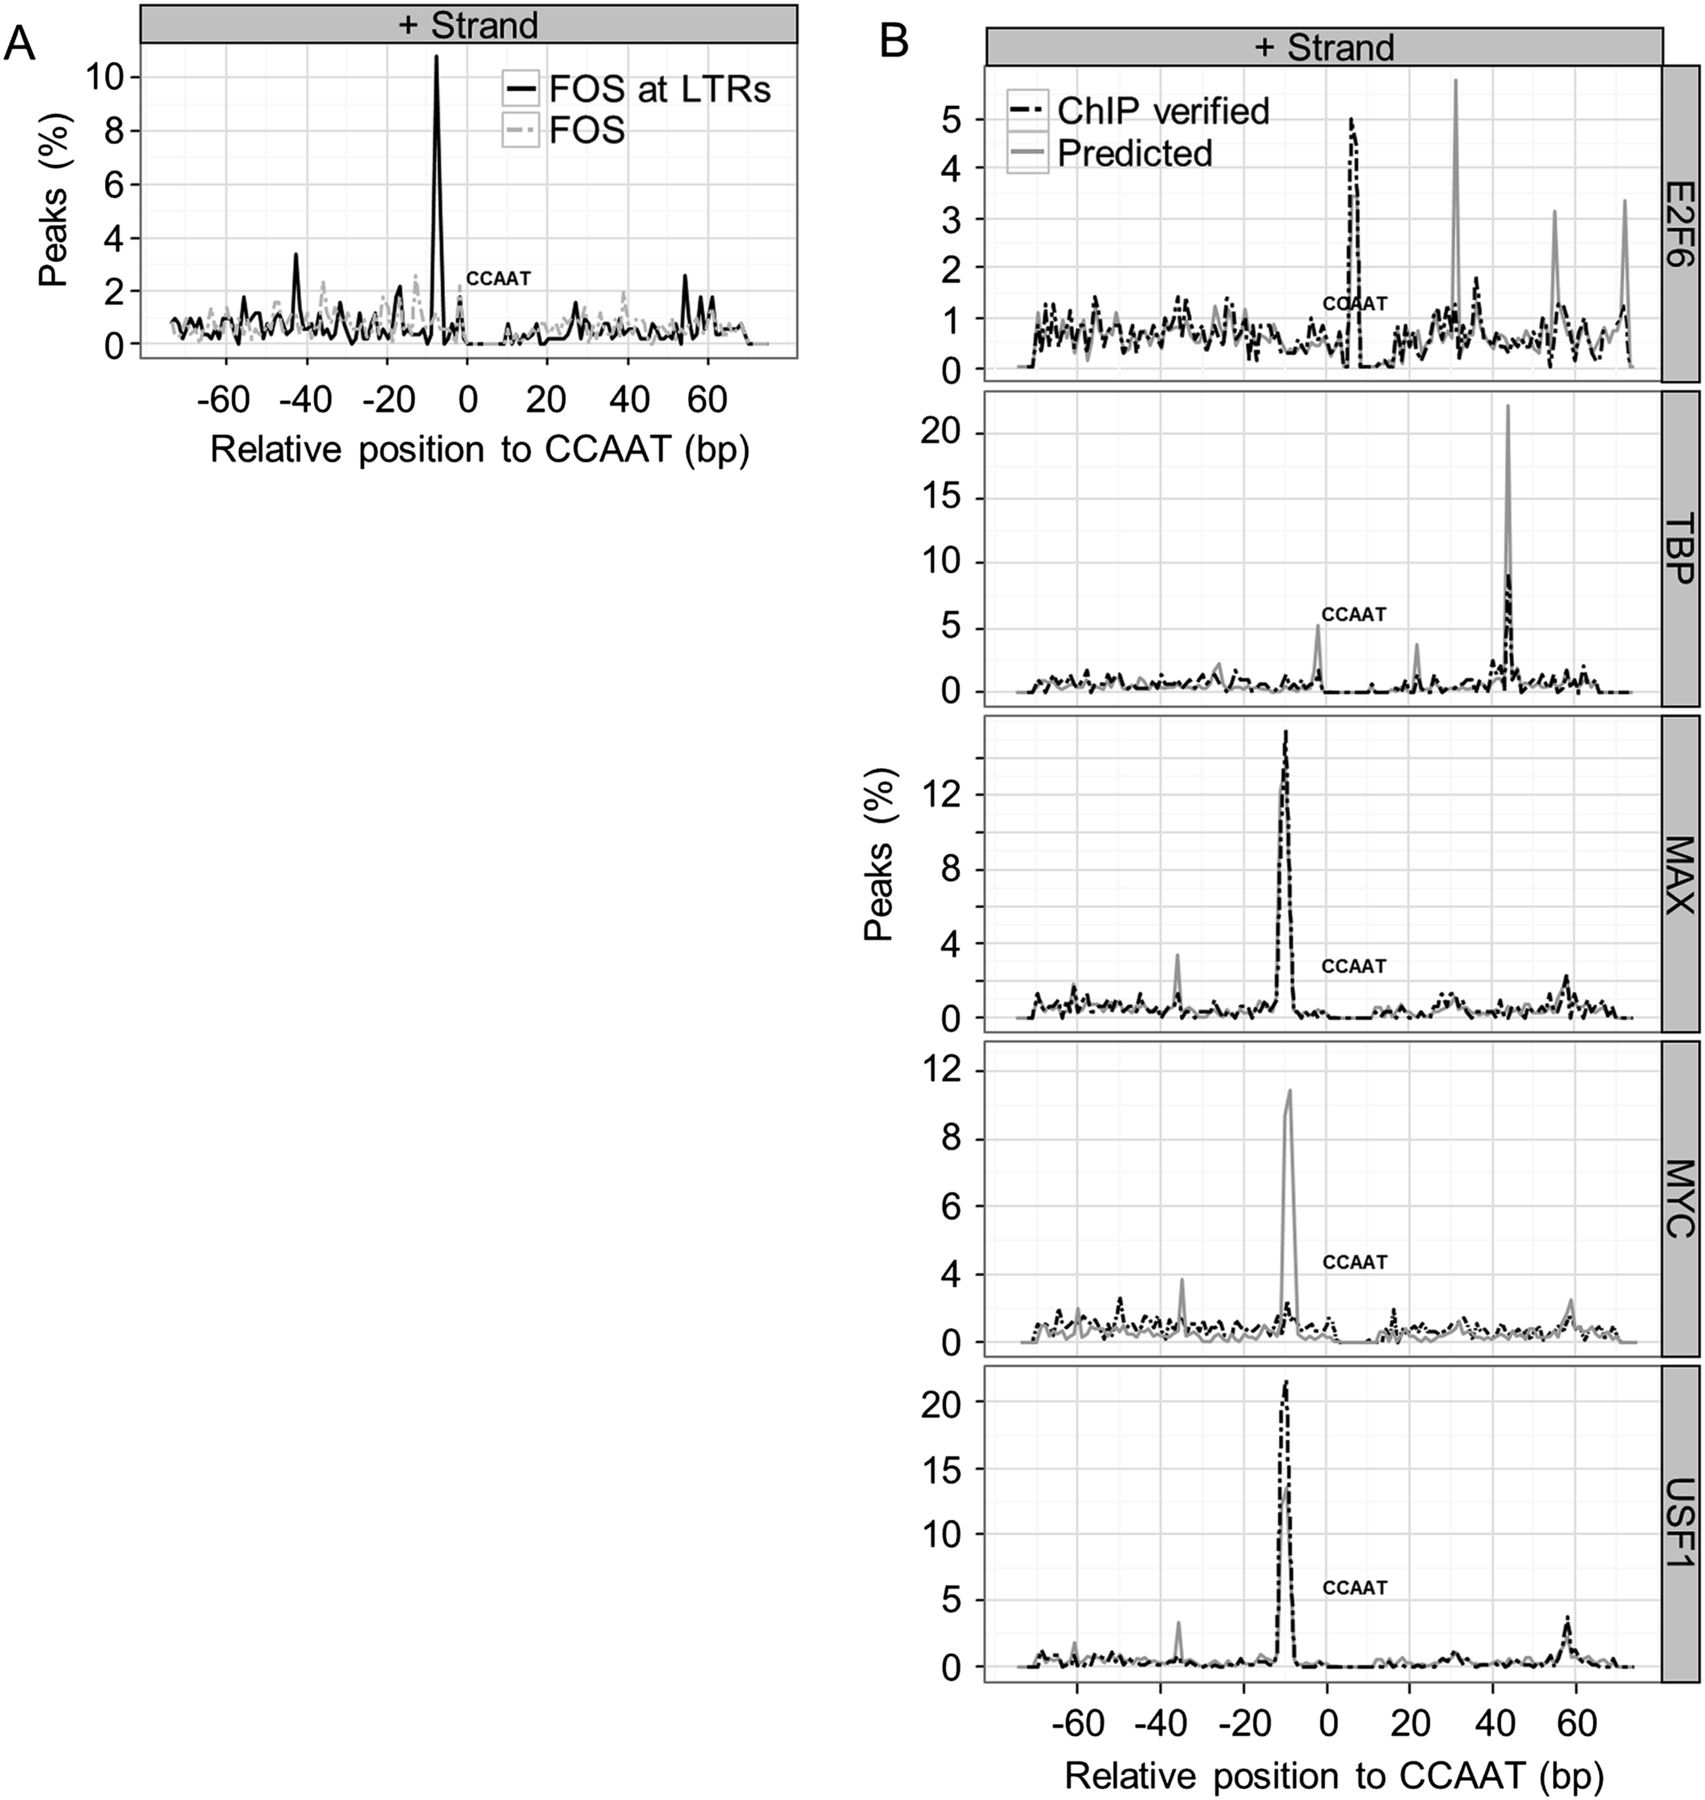
Motif pairings with the CCAAT motif are stereo positioned. (A) The percentage of NF-Y sites that have an AP-1 motif at the specified distance from the best scoring CCAAT motif centered at 0 bp. NF-YB peaks overlapping LTRs are categorized as “predicted,” while the subset of NF-YB sites overlapping the respective ChIP-seq sites of FOS are categorized as “verified.” The negative strand plots are near identical mirror images of the positive strand plots and are not shown. (B) Similar to A, except that all genomic regions are considered. The percentage of NF-YB peaks that have a TATA element (TBP), E box (MYC, MAX, USF1), and E2F motif (E2F6) are plotted. All NF-Y peaks are categorized as “predicted,” while those NF-Y peaks overlapping the respective ChIP-seq peaks of the other TF are categorized as “verified.” Only the top 500 peaks in each category are plotted.


