
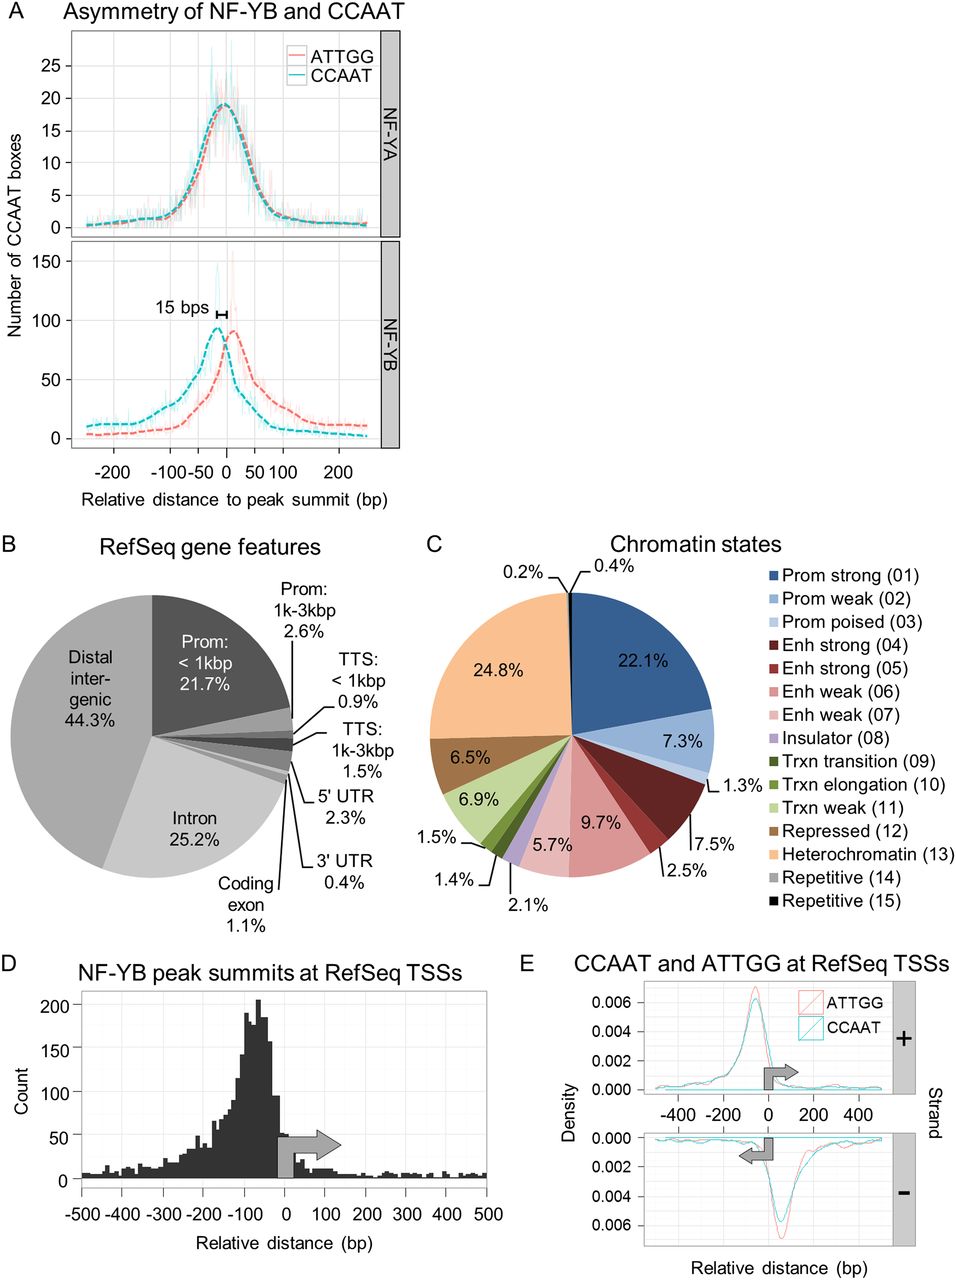
Annotation of NF-Y peaks to genomic features. (A) Kernel density estimate of the distribution of the 5′-CCAAT-3′ and 5′-ATTGG-3′ sequences under NF-YA and NF-YB peaks in relation to the peak summit centered at 0 bp. Only the position of the best matching CCAAT motif within 100 bp of the peak summit is considered and plotted. (Solid and dashed lines) Raw and Gaussian smoothed data, respectively. (B) Annotation of K562 NF-YB sites to RefSeq gene features. (C) As in B, except chromatin state maps are used. (Prom) promoter; (enh) enhancer; (trxn) transcription. Numbering is from the chromatin state maps of Ernst et al. (2011). (D) Frequency distribution of K562 NF-YB peak summits at RefSeq TSSs showing a preferential location between −50 and −100 bp upstream of the TSS. (E) Gaussian kernel density estimate of the distribution of positive and negative strand 5′-CCAAT-3′ and 5′-ATTGG-3′ sequences at K562 NF-YB-bound RefSeq TSSs. Only the best motif per region is considered. Bandwidth is equal to the standard deviation of the smoothing kernel. (Gray arrows) Direction of transcription.


