
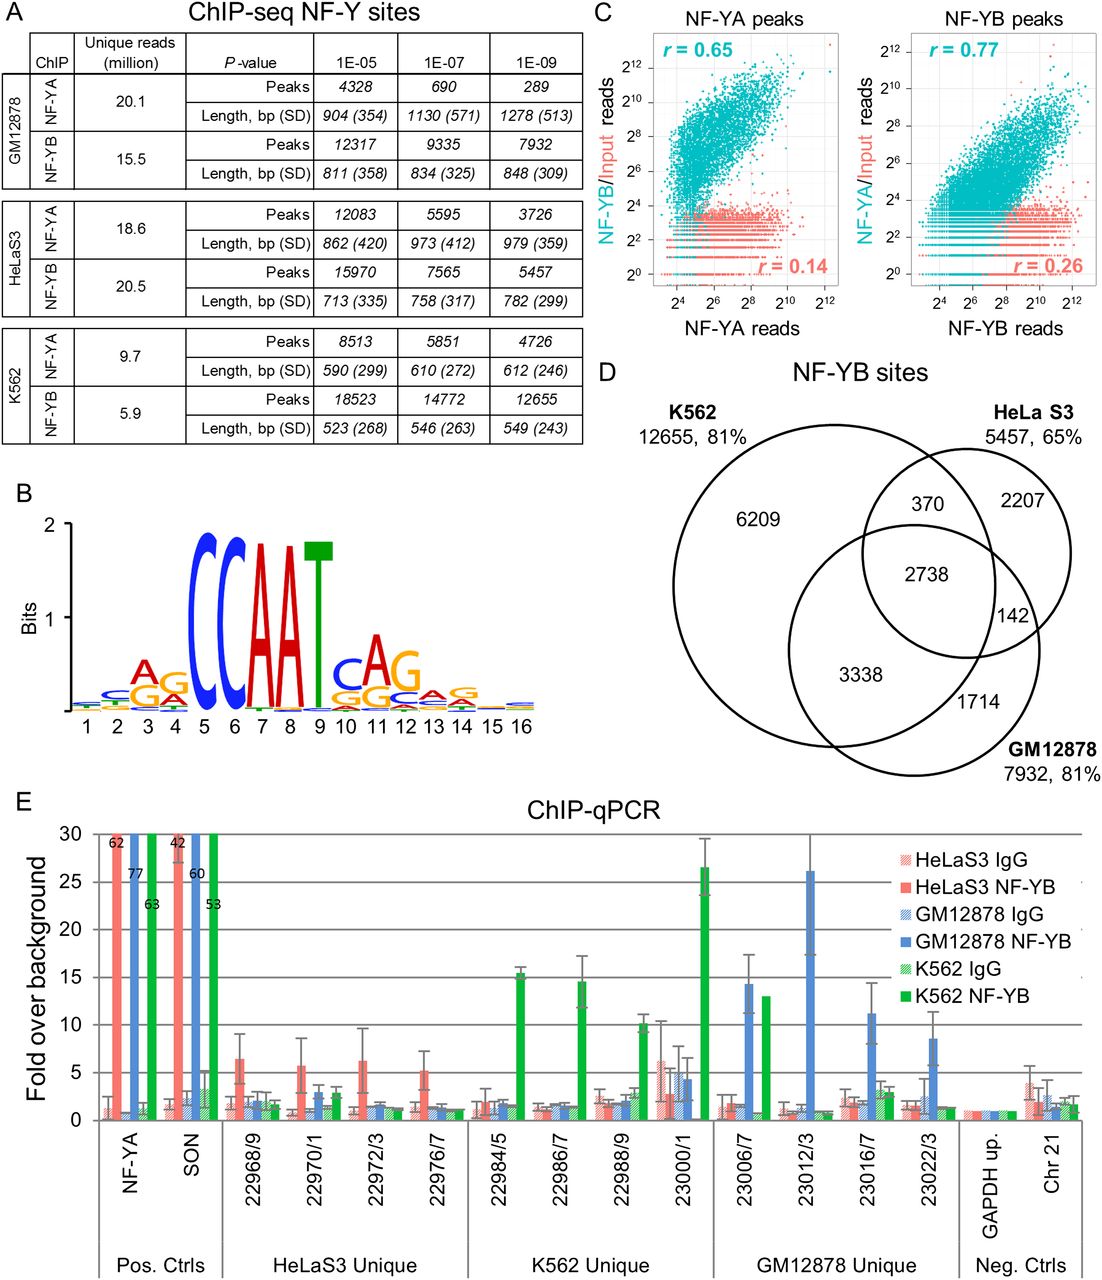
ChIP-seq of two components of the NF-Y complex in three cell types. (A) MACS peak analysis indicating peak numbers, mean peak lengths, and standard deviations at three different P-value thresholds for NF-YA and NF-YB ChIP-seq data sets in GM12878, HeLa S3, and K562. (B) Identification of the NF-Y DNA-binding site motif de novo from 12,655 K562 NF-YB peaks depicted as a sequence logo (Schneider and Stephens 1990). (C) Scatter plots of NF-YA, NF-YB, and input read counts at NF-YA or NF-YB sites in K562 showing correlation between data sets. (Blue shading) Correlation amongst NF-YA and NF-YB. (Orange shading) NF-YA or NF-YB correlation to input. (D) Venn diagrams depicting the overlap between NF-YB peak populations in GM12878, HeLa S3, and K562. Integers represent peak numbers called at the 10−9 P-value threshold. The percentages of peaks with CCAAT motifs are indicated (%). (E) ChIP-qPCR validation of NF-YB peaks unique to each cell type. (Error bars) Standard deviation of three biological replicates. “Pos. Ctrls” are loci known to be bound by NF-Y. “Neg Ctrls” are loci known to be devoid of NF-Y. Data represents a fold over background measurement compared with a non-NF-Y bound region (“GAPDH up”). (Solid and striped bars) ChIPs performed with NF-YB specific antibody and nonspecific rabbit IgG, respectively.


