
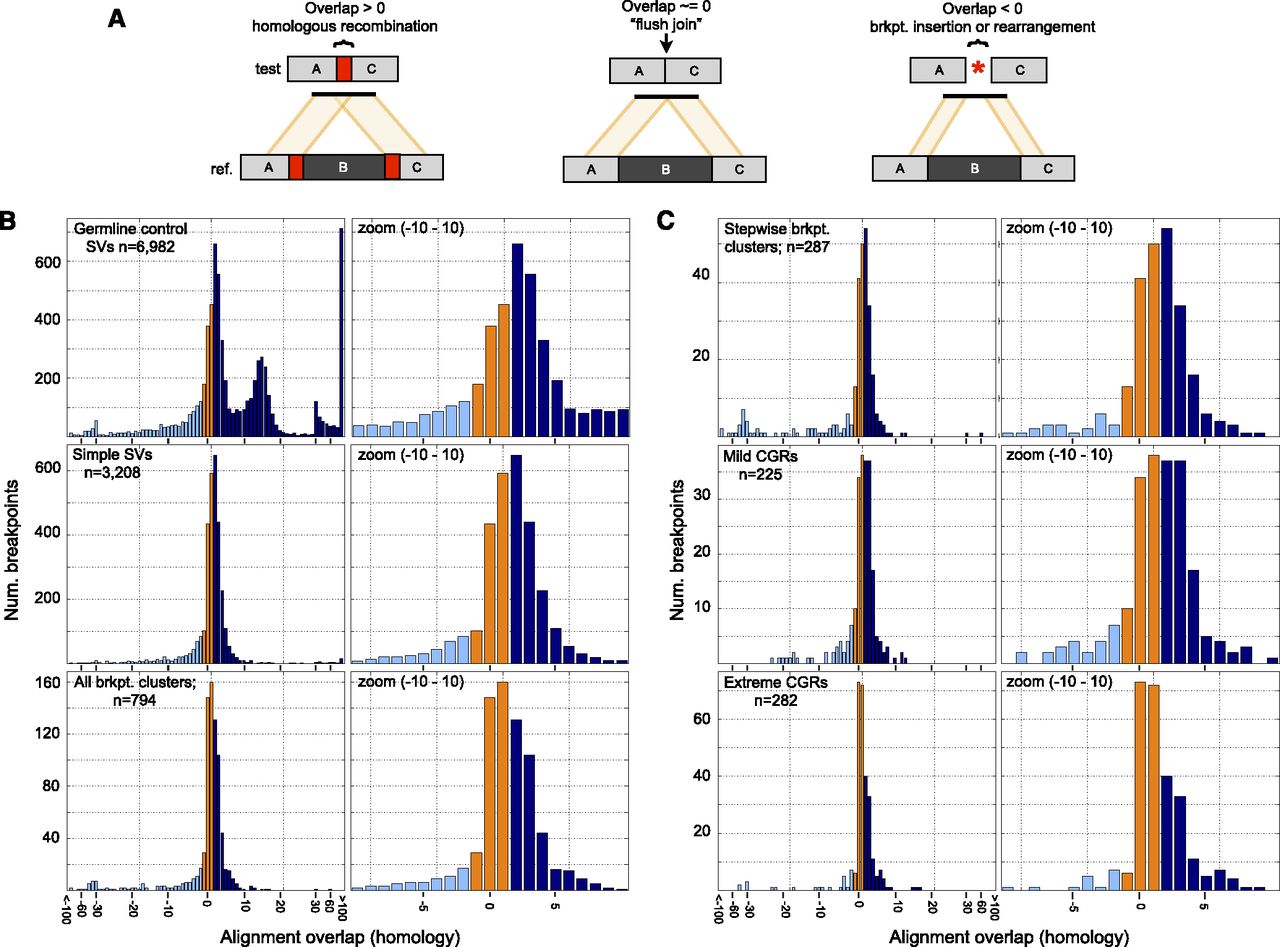
Breakpoint homology profiles. (A) When breakpoint-containing contigs are mapped to the reference genome, homology is apparent as “alignment overlap” between adjacent segments on the contig (left). “Flush” breakpoints containing no stretches of homologous DNA will have alignment overlap of approximately zero (middle). SV breakpoints harboring small insertions or small-scale rearrangements will generally have an unaligned segment, which manifests as a negative alignment overlap value (right). Occasionally, negative overlap values may also be caused by misalignment due to DNA sequencing errors or reference genome assembly errors at repeats. Overlap values are colored based on whether they are less than −1 (light blue), between −1 and 1 (orange), and >1 (dark blue). (B) Alignment overlap at germline control breakpoints (top), simple SV breakpoints (middle), and breakpoint clusters (bottom). Please note that the x-axis scale is irregular. Overlap is measured in 1-bp increments until −30 and 30, after which it is measured by tens. All breakpoints with 100 or more bases of overlap, or −100 and fewer bases, are shown at the rightmost and leftmost bars. The entire plot is shown at left and an x-axis zoom from −10 to 10 is shown at right. (C) Alignment overlap at stepwise and complex rearrangements classes following the same conventions as panel B.


