
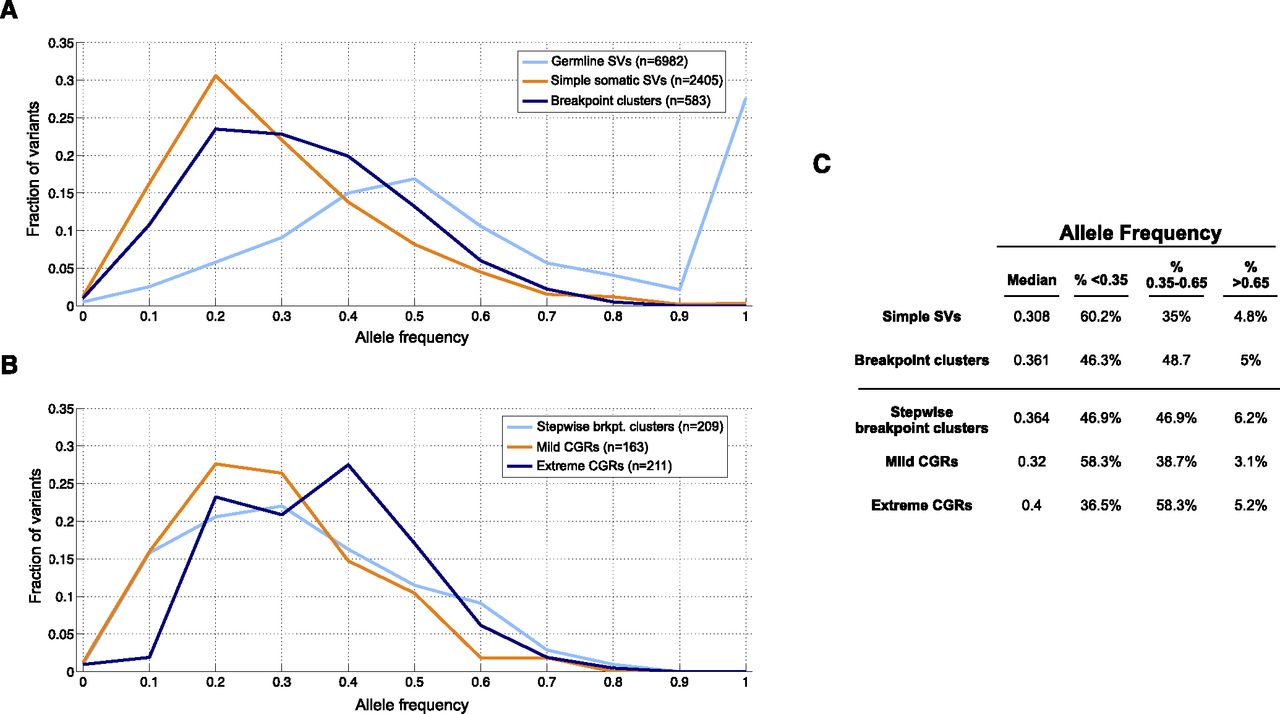
Figure 7.
Intra-tumor breakpoint allele frequency (BAF). (A) BAF distribution for germline duplications and deletions (light blue), simple SVs (orange), and complex breakpoint clusters (dark blue). For germline breakpoints present in multiple samples, each BAF measurement of that breakpoint is shown. (B) BAF distribution for stepwise and complex rearrangements. (C) Table showing the median BAF for different breakpoint classes, and the percentage of breakpoints that have low (<0.35), high (0.35–0.65), and unusually high (>0.65) BAF.


