
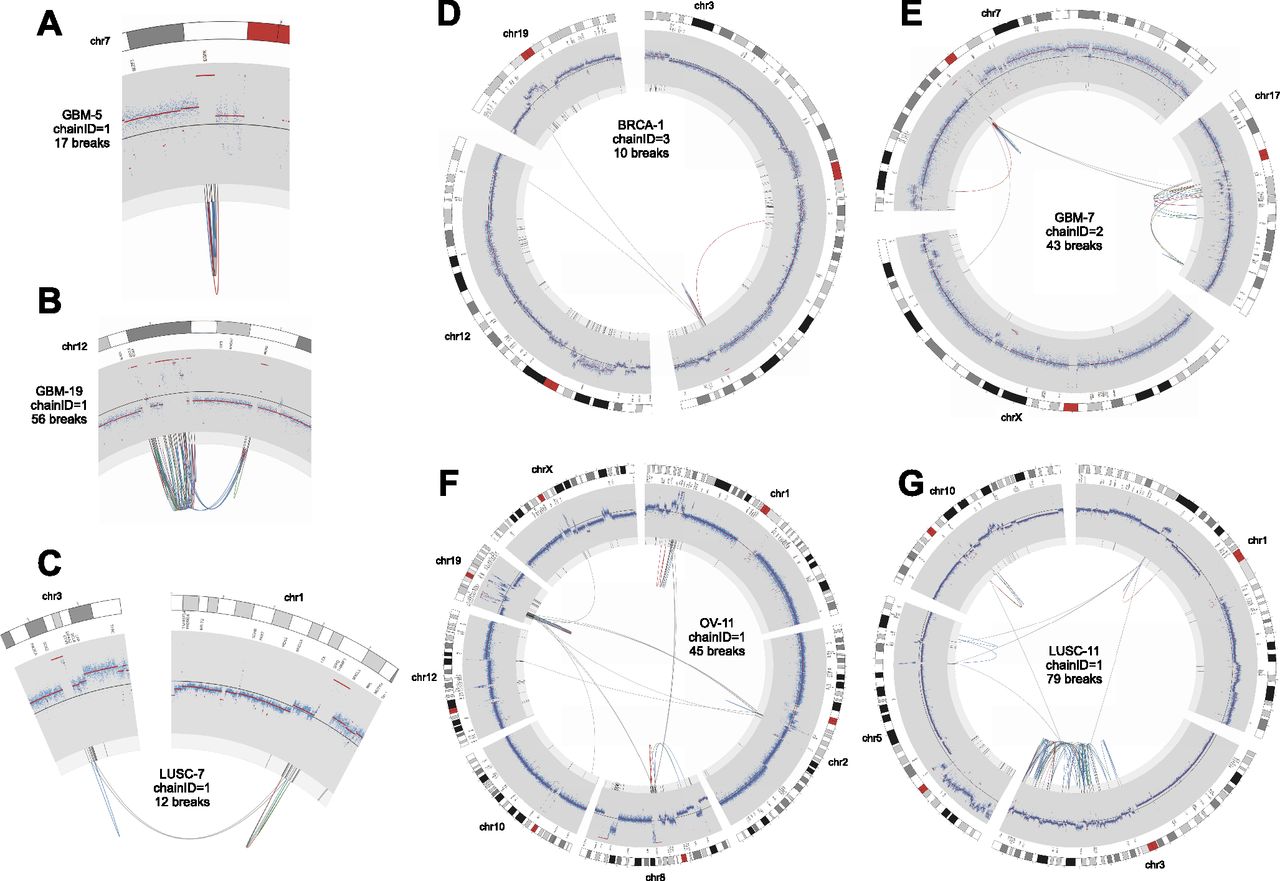
Circos plots of stepwise breakpoint clusters. Only the chromosome(s) and breakpoints involved in the rearrangement are shown. Chromosome coordinates increase in the clockwise direction. The chromosome name is indicated outside the circle. The outermost track is the cytogenetic band, with the centromeres (red). Moving inward, the second track is COSMIC cancer genes. Next is a plot showing the copy number profile obtained from read-depth analysis. This profile includes germline CNVs and somatic CNAs. The track shows normalized read depth, represented as a Z-score (blue dots) and segmented read-depth data (red line plotted on top of the blue dots). The y-axis limits correspond to the median Z-score ±7.5 median absolute deviations. The next track shows the somatic CNA change-points (lighter gray track inside of the read-depth track). Rearrangements are depicted as lines connecting points on the circular chromosome(s) with deletion breakpoints (red), duplications (green), and inversions (blue). Note that these breakpoint classes are defined by the relative orientation of the joined genomic segments, and may not actually involve deletion or duplication of sequence. (A) A focal amplification at the EGFR gene. (B) A multifocal amplification. (C) Coamplification linked by inter-chromosomal rearrangement. (D–F) Increasingly complex patterns of amplification plus rearrangement. (G) A CGR from a LUSC genome with a highly rearranged chr3q, perhaps due to breakage-fusion-bridge.


