
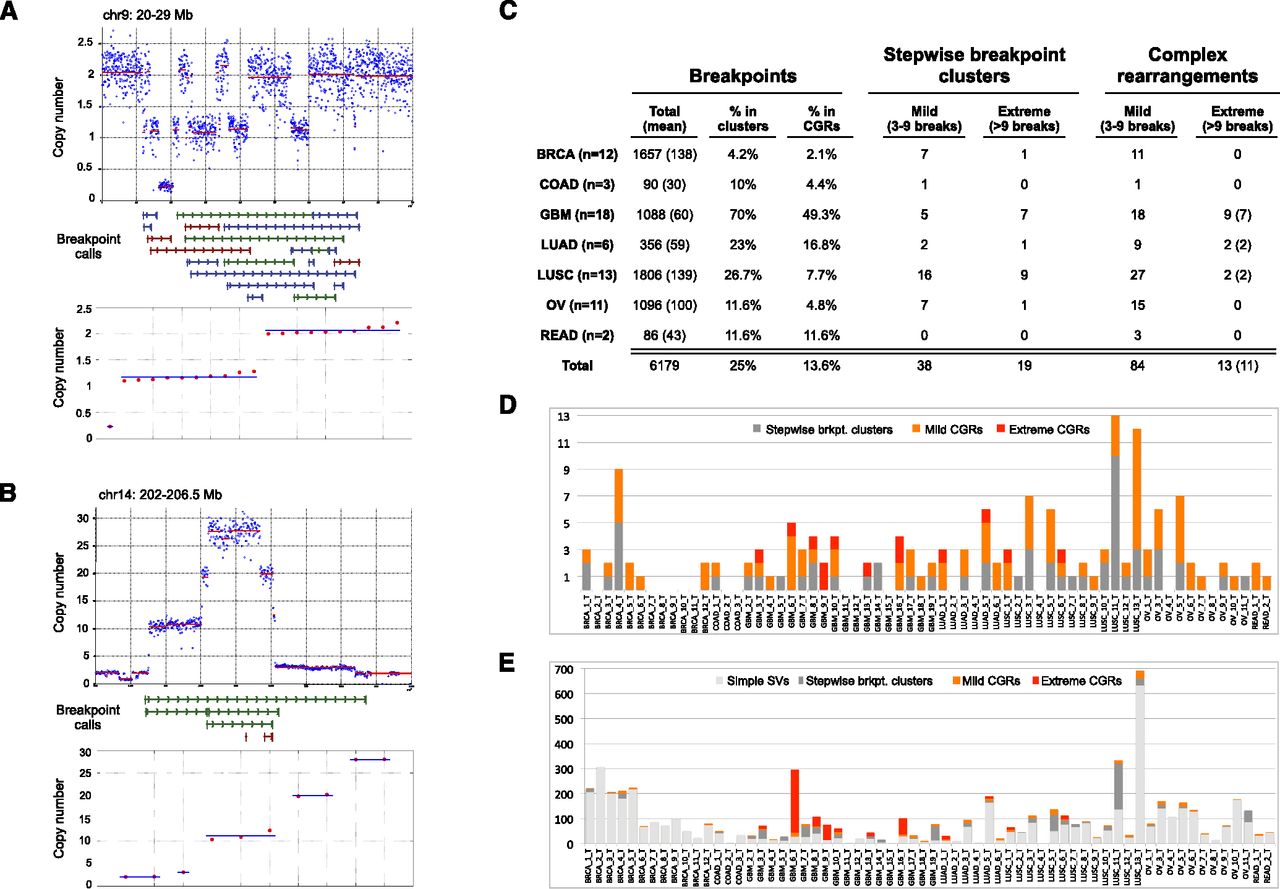
Prevalence of CGRs. (A) An example of copy number state determination. On top is a plot showing the raw (blue dots) and segmented (red line) read-depth data at a CGR with three copy number states. (Middle panel) HYDRA-MULTI breakpoint calls, with deletions (red), tandem duplications (green), and inversions (blue). The bottom panel shows the results of clustering CNA change-points into copy number states, where copy number values are sorted in ascending order and clusters with the same state are shown with a blue line. (B) Same as panel A, except a stepwise rearrangement with five copy number states. (C) The number of stepwise and complex rearrangements by tumor type, as shown at left. Columns correspond to the total number of breakpoints, the percent that are in clusters, the percent judged to be complex, and the number of mild and extreme events for stepwise and complex rearrangements. For the rightmost column, the number of samples exhibiting extreme CGRs is shown in parentheses. (D) The number of CGRs observed for each tumor. (E) The number of breakpoints in each tumor, broken down by complexity class.


