
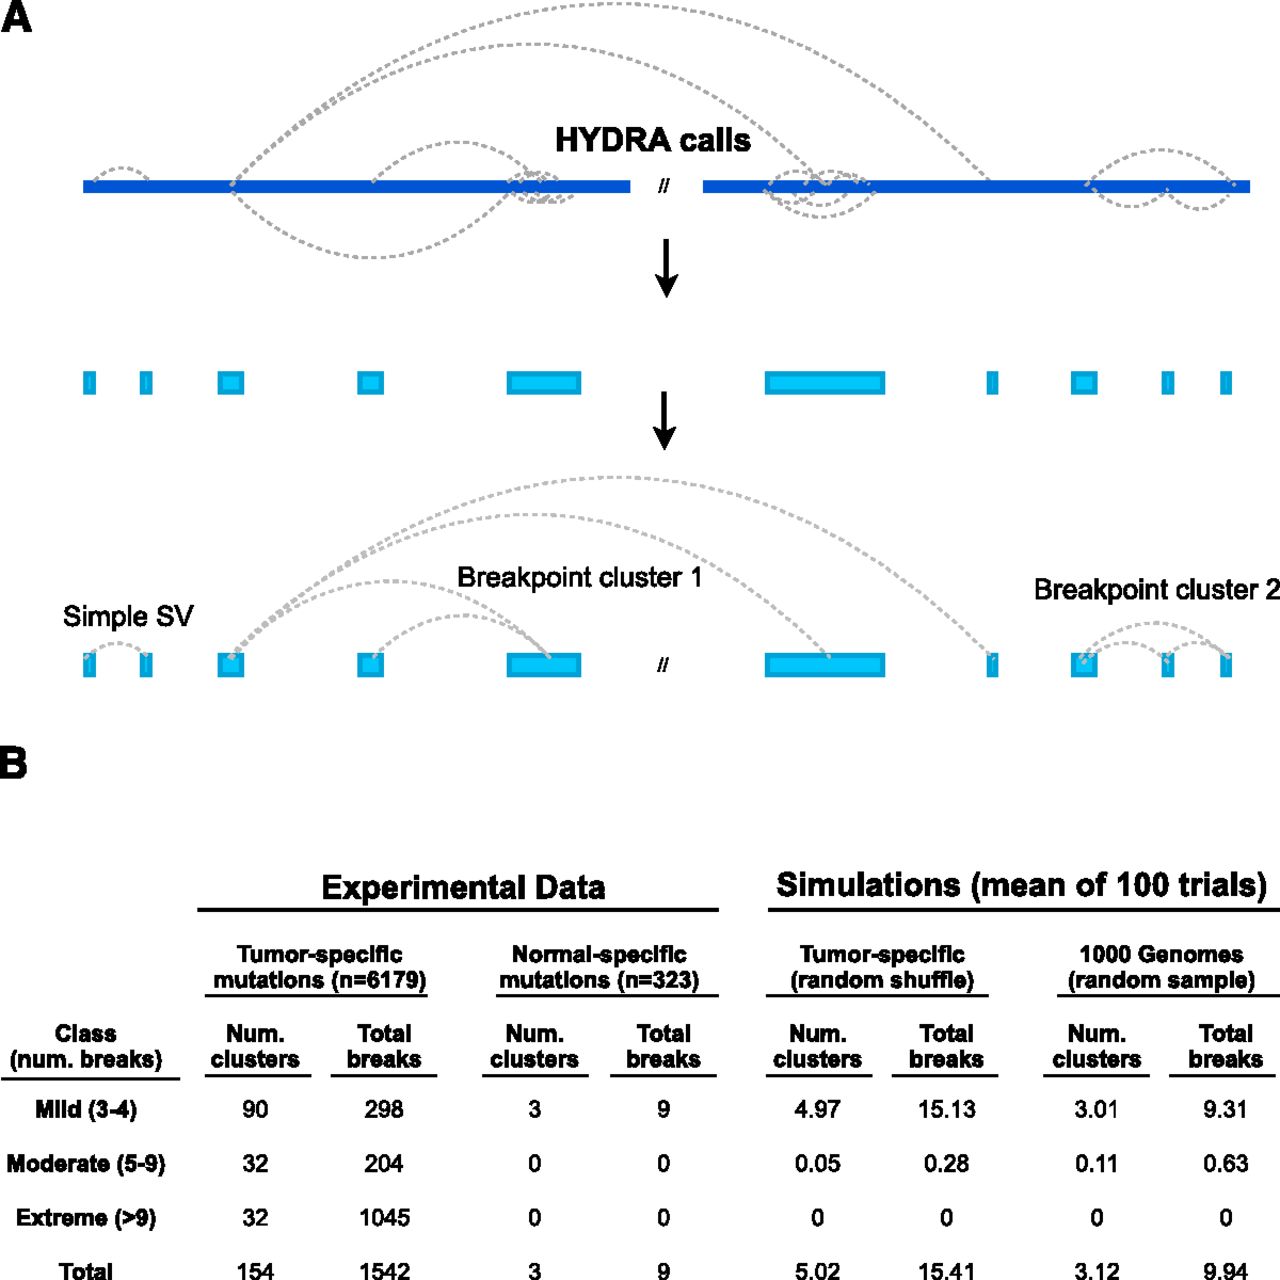
Detecting complex genomic rearrangements (CGRs). (A) HYDRA-MULTI calls are shown as dotted lines connecting distinct loci in the reference genome (blue bar at top), with each call predicting a single novel junction in the test genome corresponding to exactly two loci in the reference. Breakpoints found within 100 kb of each other are merged, and “breakpoint clusters” are formed by chaining together loci linked by one or more breakpoint calls. (B) Table showing the results of breakpoint clustering and simulation, broken down by severity (as defined at left). The left half of the table shows breakpoint clusters identified from experimental data, using either tumor-specific somatic mutations or normal-specific “somatic mutations” (false positives). The right half shows simulation results based on randomly shuffling genomic coordinates of somatic SVs, or from randomly sampling 1000 Genomes deletions.


