
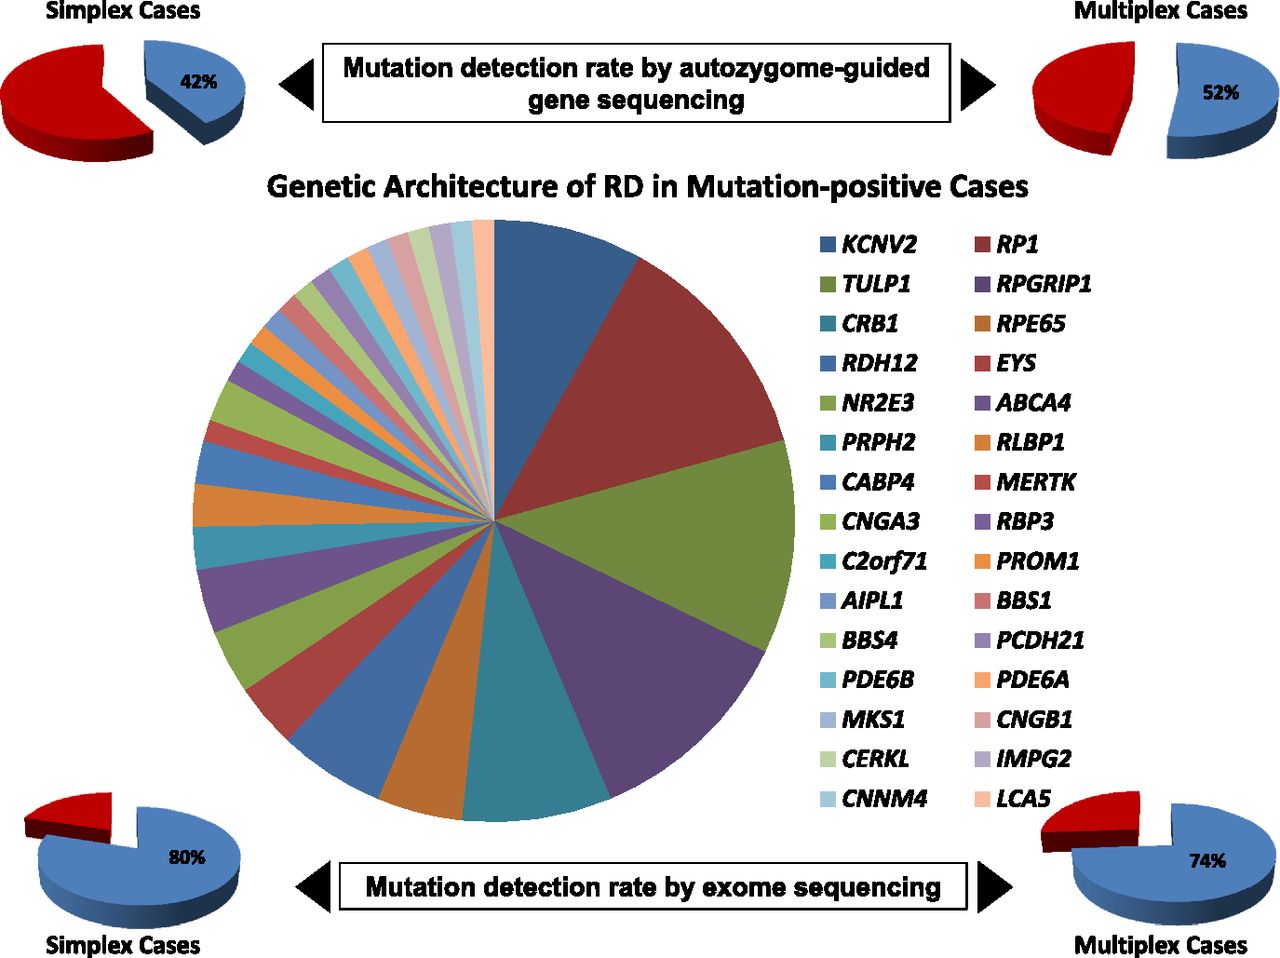
Figure 2.
Central pie chart summarizes the contribution of various genes to the overall mutational pool among RD patients in the current study. Pie charts in the upper panel show the percentage of mutation-positive cases among simplex and multiplex cases using the autozygome-guided gene sequencing approach. Pie charts in the lower panel show the percentage of mutation-positive cases among simplex and multiplex cases using the exome sequencing approach. Please note the percentages in these charts do not take into account the novel candidate genes identified in this study.


