
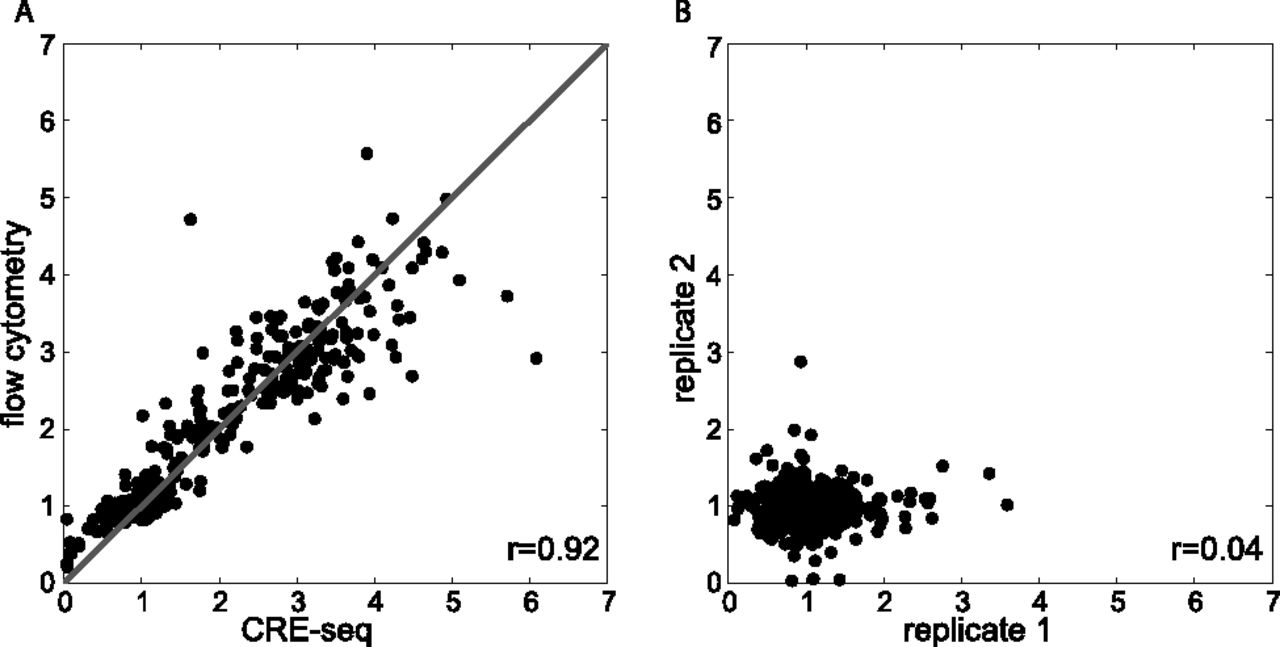
CRE-seq accurately measures gene expression. (A) Comparison between expression measured by CRE-seq and flow cytometry. Each dot represents a CRE whose activity has been measured with a traditional fluorescent assay (y-axis) and with CRE-seq (x-axis). The high correlation indicates that CRE-seq expression measurements are as accurate as those measured by traditional fluorescent assay. The line represents the perfect model (r = 1). (B) Biological replicates of a CRE-seq library where expression is controlled by one CRE matched to 602 different BCs. The library was grown and harvested two times; CRE-seq was performed independently on each replicate. Replicate measurements of BC expression are plotted on the x-axis (replicate 1) and on the y-axis (replicate 2). The absence of correlation reveals that the BCs have no reproducible effects on gene expression.


