
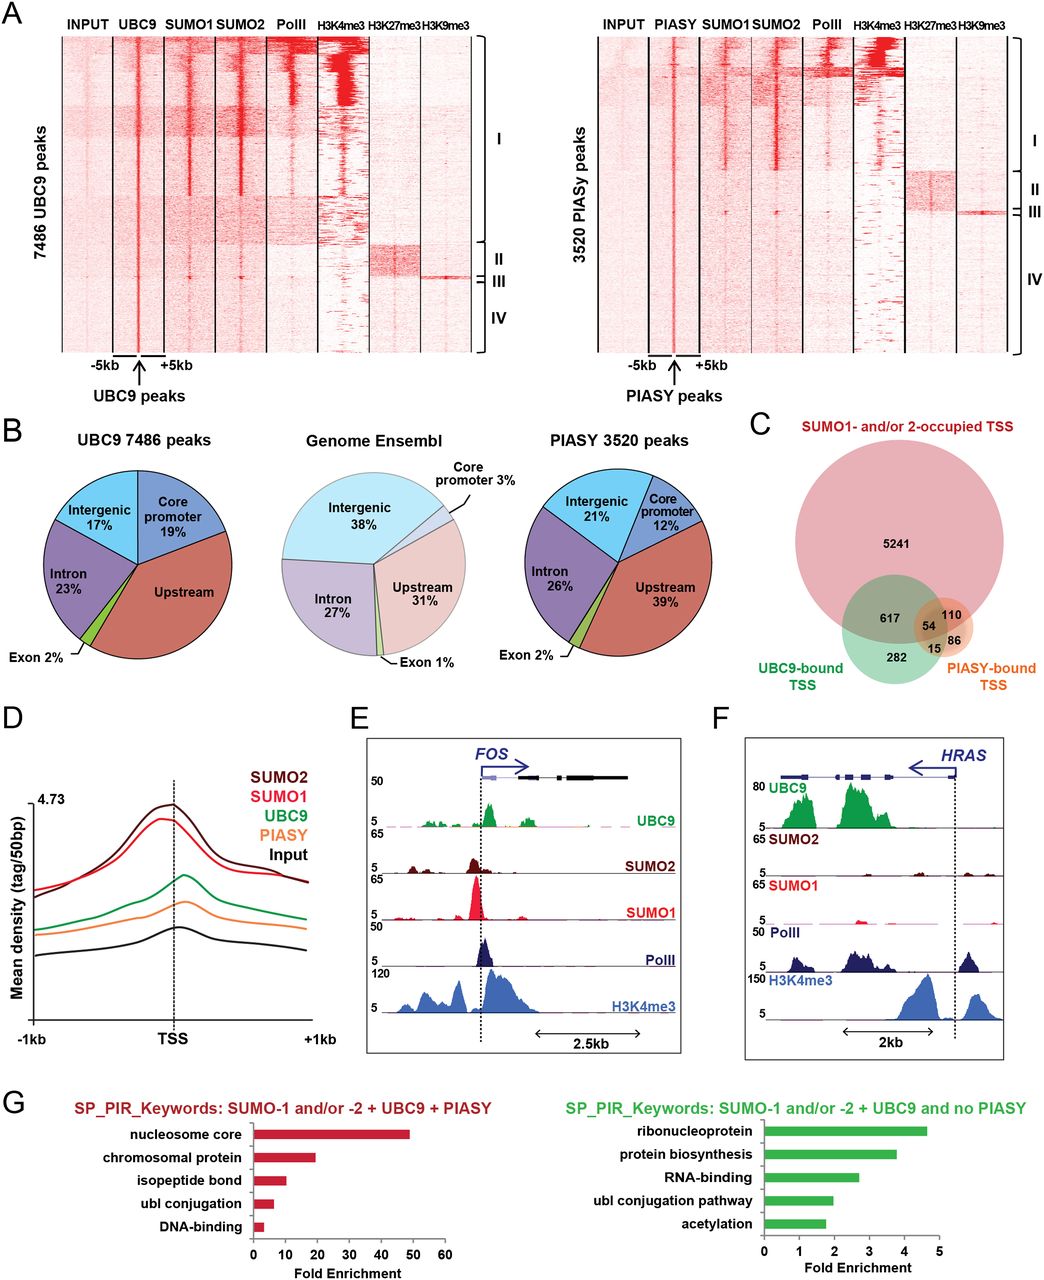
Chromatin profiles of UBC9 and PIASY. (A) Association of UBC9 (left) and PIASY (right) with SUMO1, SUMO2, Pol II, H3K4me3, H3K27me3, and H3K9me3 in WI38 proliferating cells. Comparison of the tag density in the ±5-kb region around UBC9- or PIASY-bound loci. Clustering identifies four classes as indicated. (B) Pie chart representation of UBC9 and PIASY binding site distribution in five different genomic regions as described in Fig. 1B. (C) Venn diagram representing overlap between SUMO1- and/or SUMO2-, UBC9- and PIASY-marked TSS. (D) Merged profiles of the SUMO machinery read density with respect to distance from TSS. (E,F) A Genome Browser view of the indicated ChIP-seq data at the FOS (E) and HRAS loci (F). (G) DAVID functional annotation of TSS marked by SUMO, UBC9, and PIASY (left) or SUMO, UBC9, but no PIASY (right). The top overrepresented categories are shown.


