
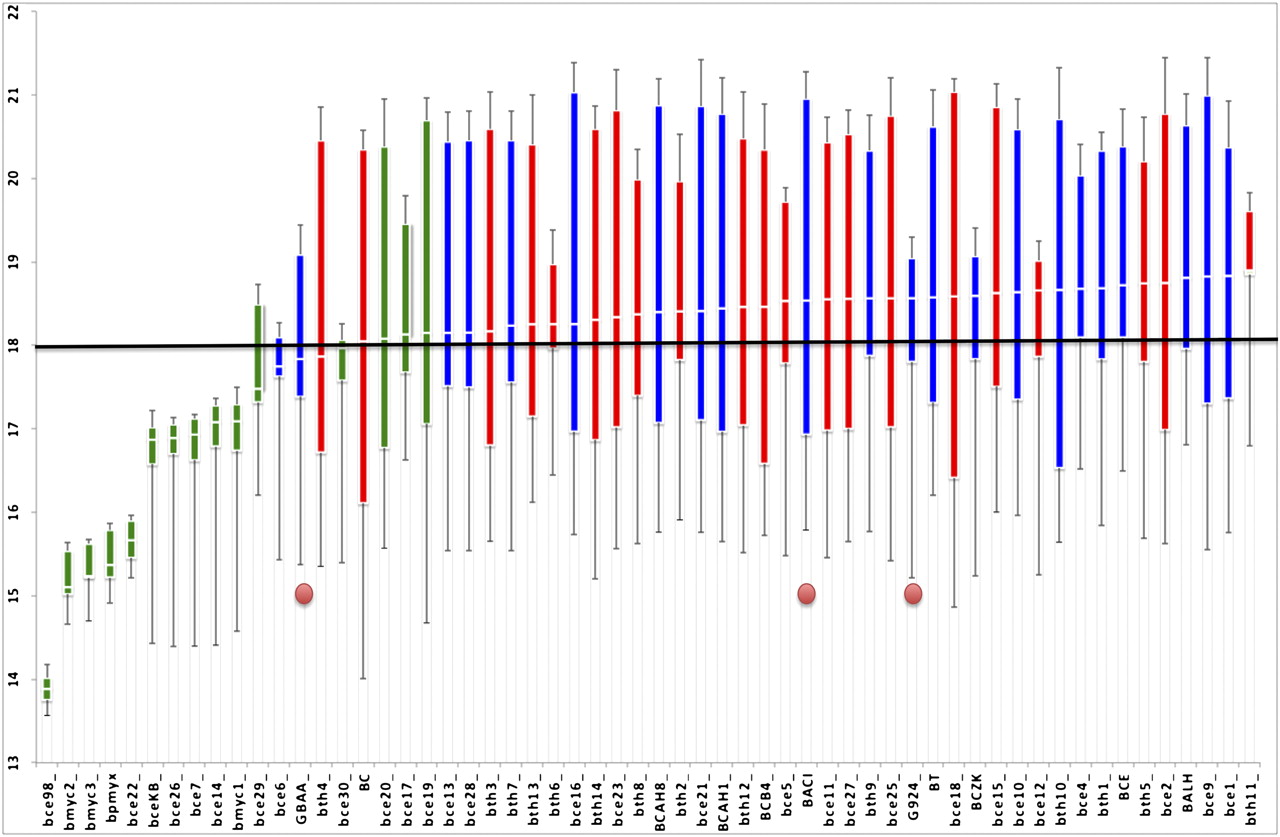
Figure 6.
ANOVA analysis for pairwise inverse dN/dS for each genome. The figure shows the results of an ANOVA analysis performed to compare the mean pairwise dN/dS ratios estimated for each of the genomes. The whiskers of each data point box are the minimum and maximum values, and the solid boxes are the 25%–75% percentile ranges. The color of boxes indicates the clade of the genomes (blue, clade 1; red, clade 2; green, clade 3). (Horizontal line) Overall mean of inverse of all the mean pairwise dN/dS ratios (17.94). (Red circles) The three pXO1-containing strains.


