
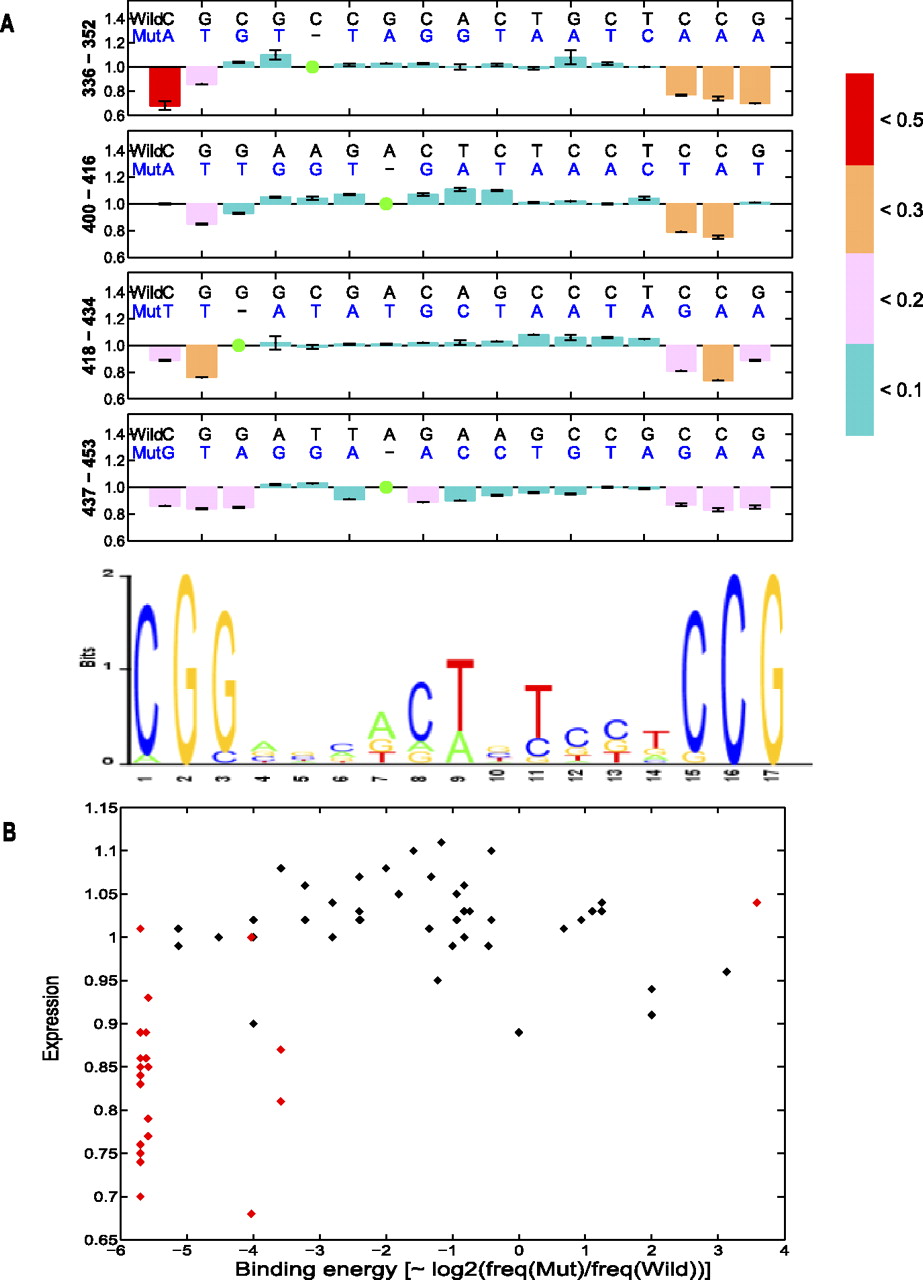
Expression variations among four Gal4 binding sites in the GAL1-10 regulatory region. (A) The motif pattern of the Gal4 binding site is created based on the position weight matrix reported in TRANSFAC. Expression levels of each position in the Gal4 sites are shown with different colors to discriminate the degree of changes (see color map). (Green circles) Nonmutated positions. Error bars are 1 standard deviation among different yeast transformants from the same mutant construction. (B) The correlation between gene expression and binding energy for the four Gal4 binding sites. The binding energy is proportional to the log [freq(Mut)/freq(Wild)] (Stormo 1998). (Red spots) The high information content sites of the Gal4 PWM; (black spots) the low information content sites.


