
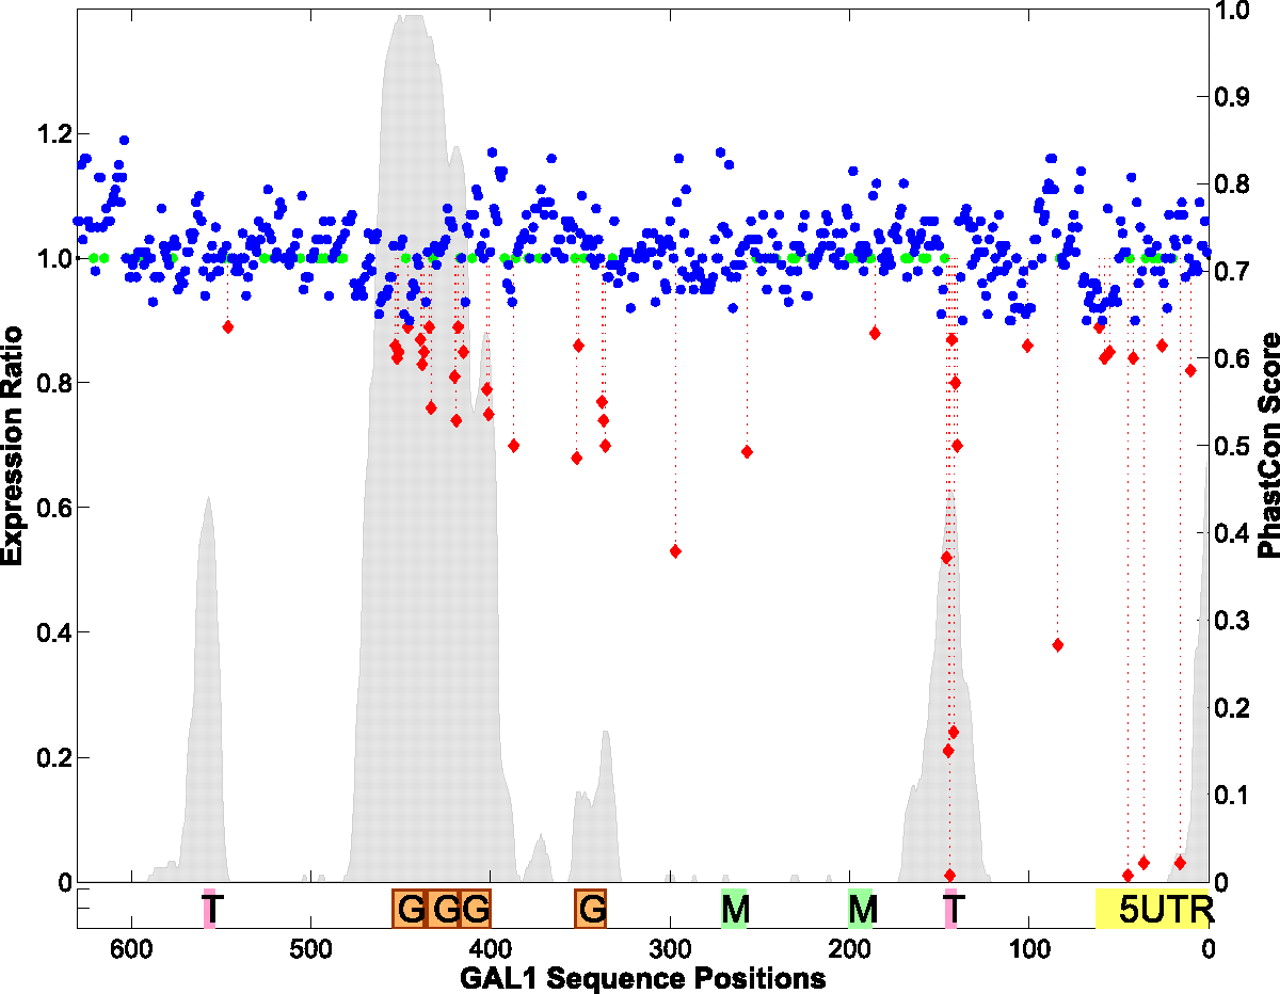
Figure 3.
Expression variation versus phastCons scores. phastCons scores are plotted in sliding windows along the GAL1-10 regulatory sequences, with y-axis labeling on the right. (Gray peaks) The regions with pronounced signals of sequence conservation. The expression ratio (ER) for each nucleotide between YFP and CFP is plotted by colored dots, with y-axis on the left [(red) ER ≤ 0.9; (blue) 0.9 < ER < 1.2; (green) nucleotides with no mutation or expression data]. Below the graphic is a panel of known functional elements: (5UTR) 5′ UTR; (T) TATA; (M) MIG1 TFBS; (G) Gal4 TFBS.


