
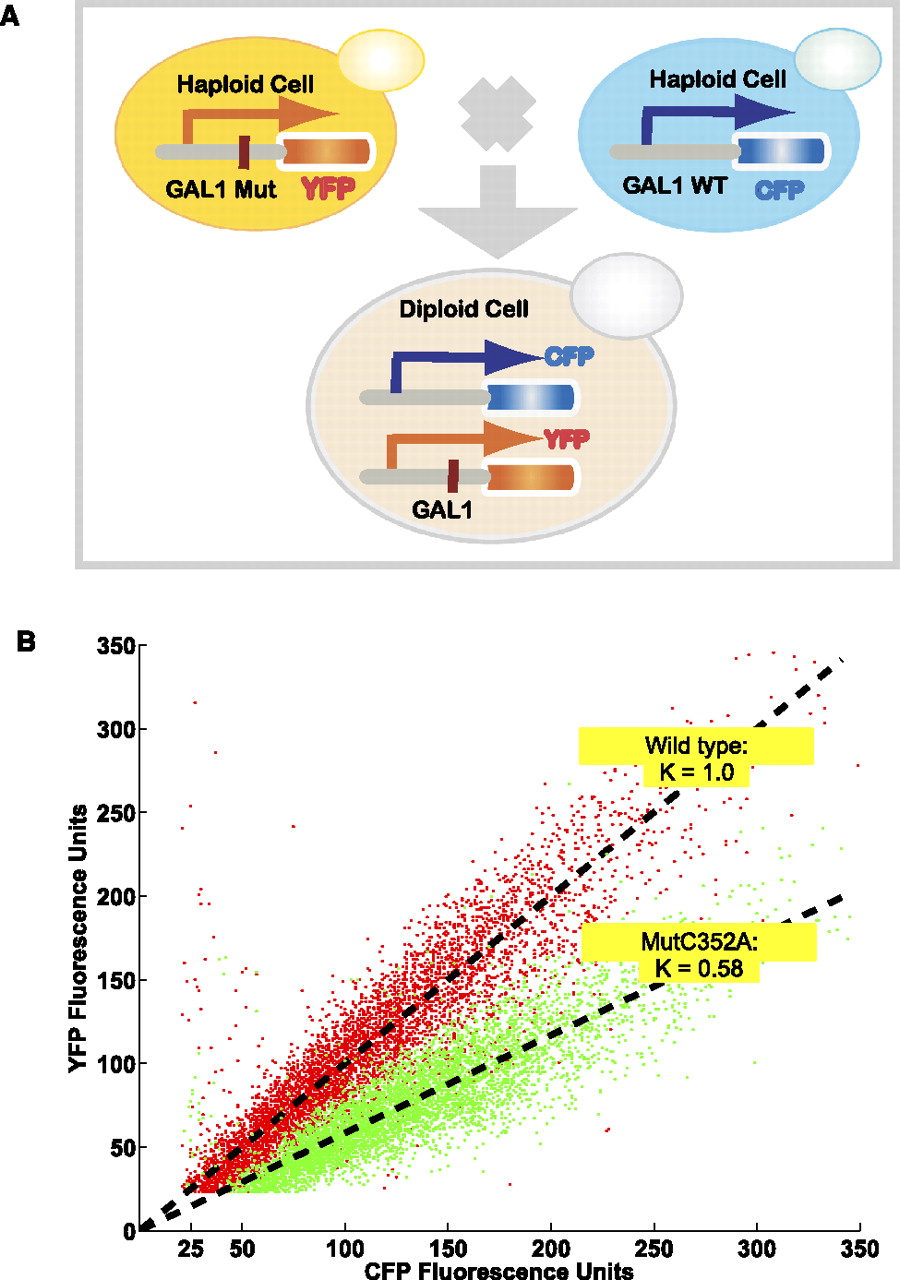
Overview of detecting expression variation for the mutation library. (A) Design of dual-color reporter system; (red bar) single nucleotide mutation; (WT) wild type; (MUT) mutant. (B) An example of determining the expression level (mutant strain Mut C352A, position 352, C → A mutation). Each dot represents the CFP and YFP fluorescence intensities from one cell. (Red dots) Cells from a wild-type diploid strain carrying a gal+-YFP and gal+-CFP fusion. The slope represents the mean of the YFP-versus-CFP ratio for a population of cells (normalized, k = 1). (Green dots) Cells from the Mut C352A strain carrying a gal--YFP and gal+-CFP fusion. The slope represents the mean for the mutant population (k = 0.58). The relative ratio between two slopes indicates the expression variation.


