
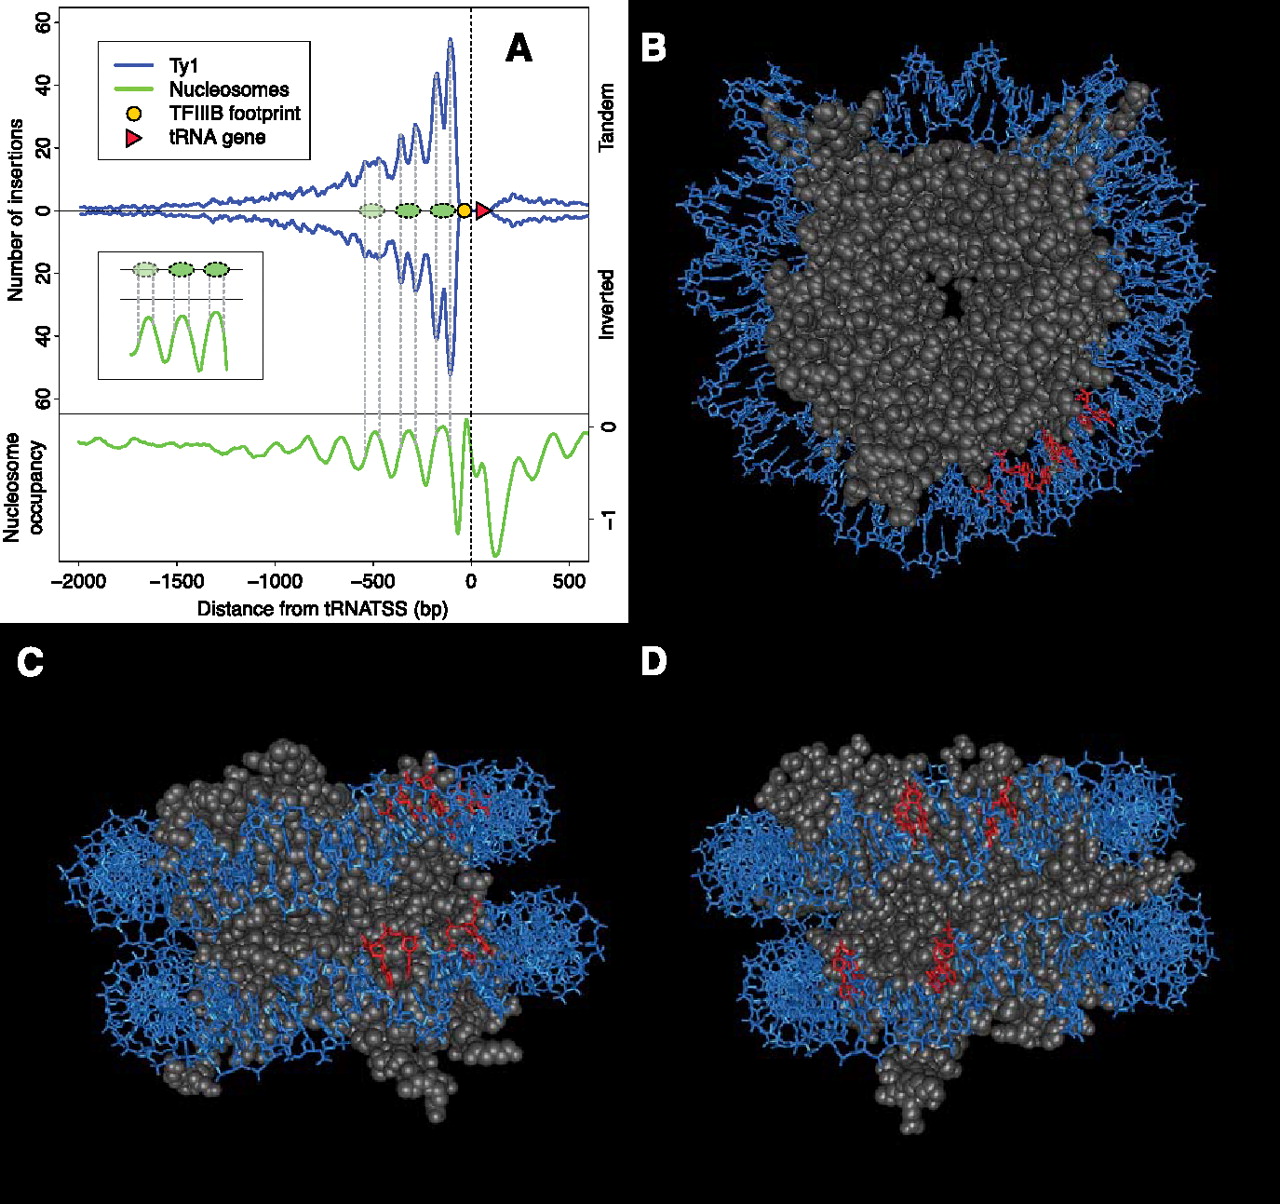
Global distribution pattern of Ty1 insertions upstream of tRNA genes relative to nucleosome position. (A) The number of Ty1 insertions is plotted relative to all 275 nuclear tRNA genes. Blue curve above midline is Ty1 insertions inserted in the same transcriptional orientation as tRNAs (Tandem); line below is elements inserted in inverted orientation. (Triangle) tRNA gene; (oval) position of TFIIIB DNA footprint. (Green line) Nucleosome positioning data (Lee et al. 2007) averaged across all tRNA genes. (Inset) Relationship between nucleosome peaks and peaks of new insertions. (B) Modeling inferred site of dinucleotides targeted by Ty1 integration (red) on front view of yeast nucleosome (PDB 1ID3). Position zero on the nucleosome is oriented at “12 o'clock” in this view. The sites were inferred from an inter-peak spacing of 73 between the midpoints of the TSDs; this implicates TSDs spanning base pairs asymmetrically disposed relative to the nucleosome dyad axis (aligned to the vertical in this diagram; see Methods). In this view, only the first half of nucleosomal DNA is shown for clarity. (C) Bottom view. In this view, the two asymmetrically disposed dinucleotides targeted by Ty1 integration can be seen. The two phosphodiester bonds predicted to be cut by Ty1 integrase are directly across the major groove from each other. (D) Nucleosome lateral surface rotated ~30° clockwise relative to C for an “integrase-eye view.”


