
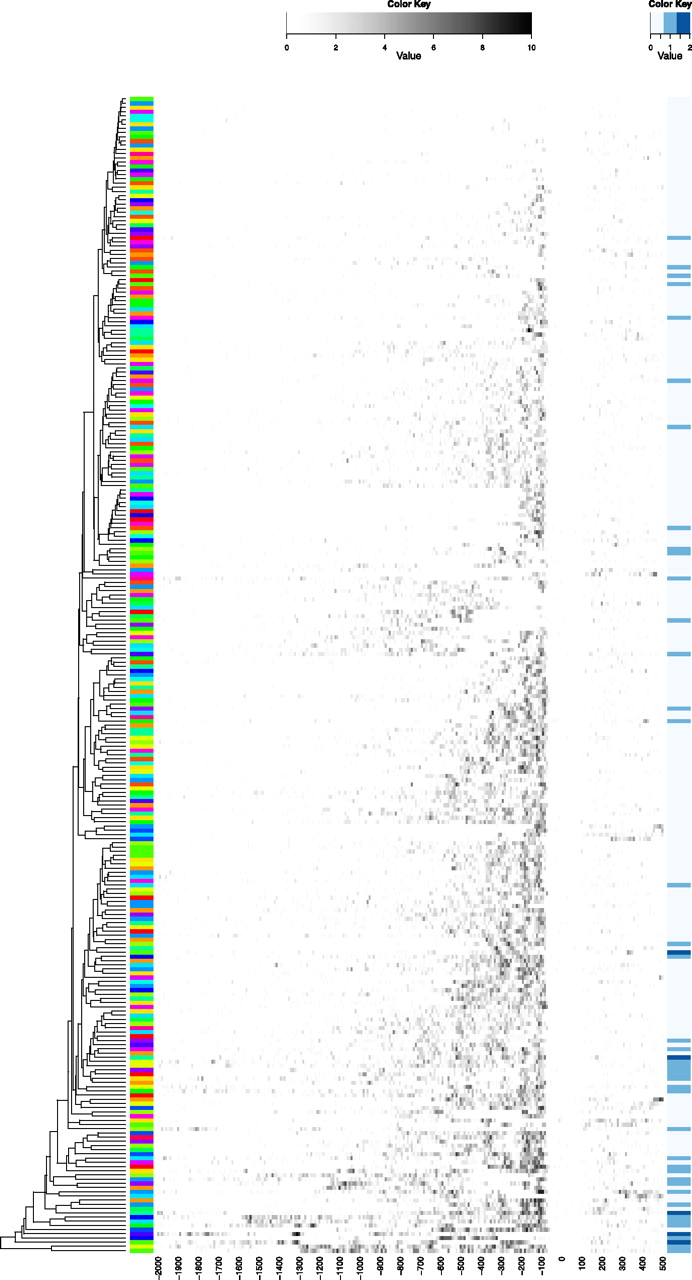
Figure 7.
Ty1 insertion pattern clustergram. tRNA genes were clustered by integration site pattern similarity on 10-bp windows. Note nucleosome periodicity vertical streaks. Isoacceptors are coded on the left side with 42 distinct colors representing 42 isoacceptor species. On the right side of the map is tRNA density in the region flanking each tRNA shown. This density correlates with Ty1 insertion propensity in the 100-bp section 5′ of each tRNA but not with the overall Ty1 insertion patterns. We do not give a key to the exact identity of the tRNA behind each color code, as we are concerned only with whether or not the colors are clustered.


