
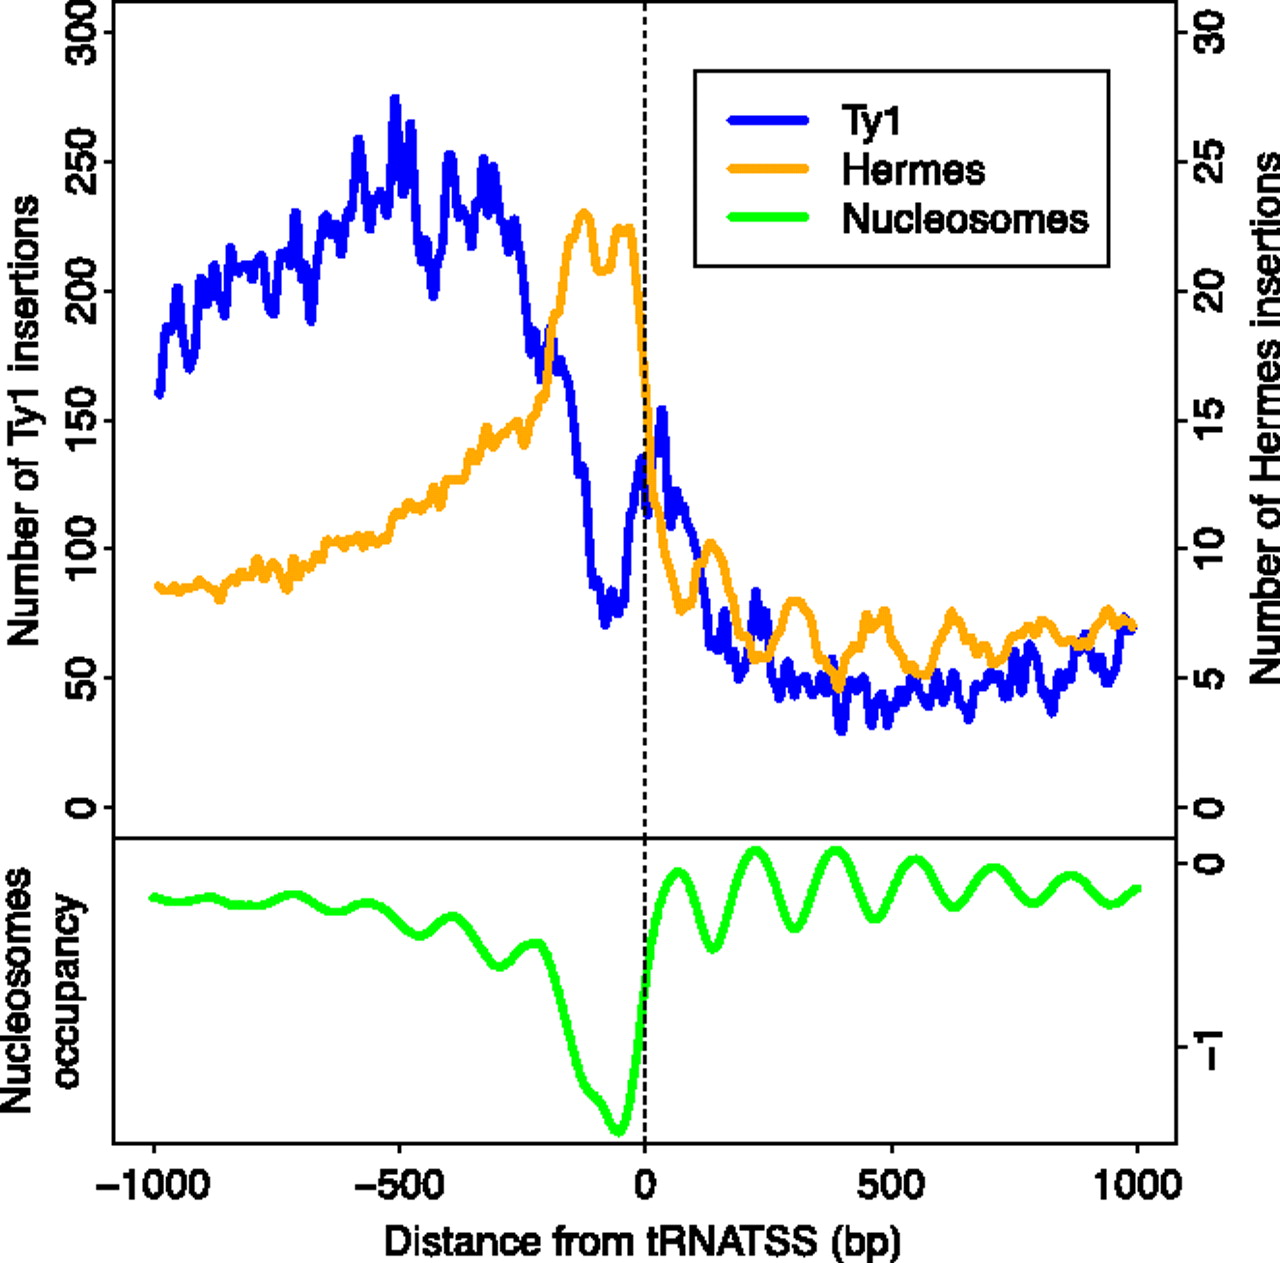
Figure 6.
Genome-wide comparison of Hermes and Ty1 insertion patterns, and nucleosome positions. The insertions are mapped relative to start or stop site of nearest pol II gene. (Blue line) Hermes insertions from Gangadharan et al. (2010); (yellow line) Ty1 insertions (this work); (green line) nucleosome positioning data (Lee et al. 2007) averaged across all tRNA genes.


