
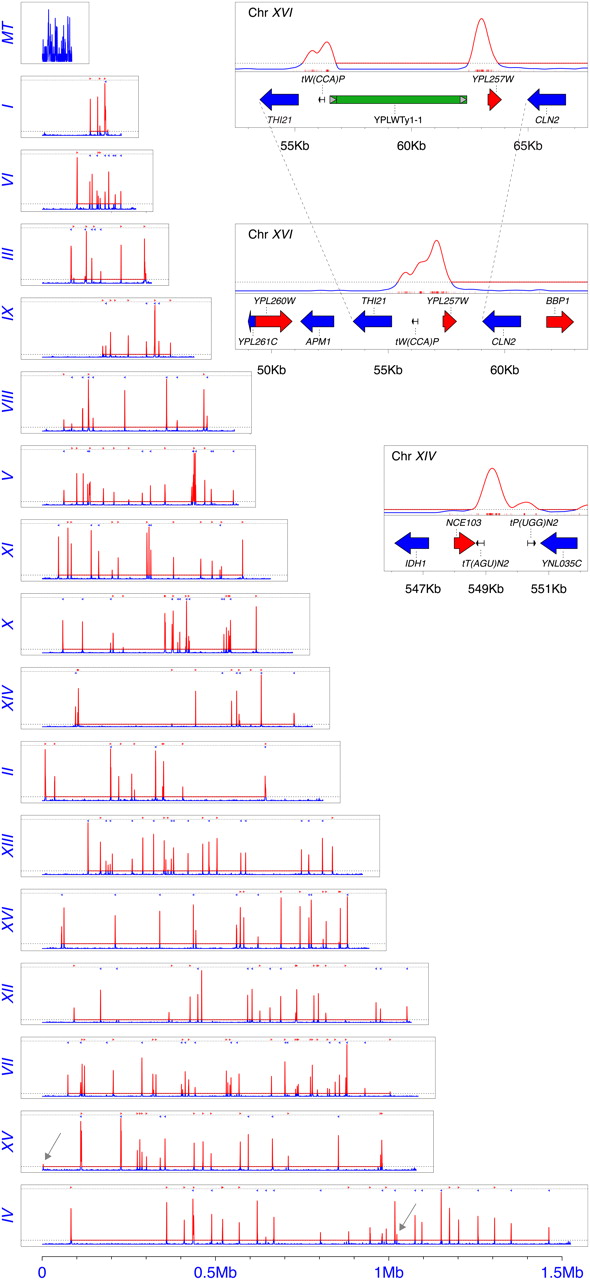
Map of Ty1 insertions. (Horizontal dashed line) Boundary of statistical significance. (Red lines) Statistically significant deviations from randomness that align to tRNA upstream regions. (Blue and red triangles) tRNA genes. (Pale blue arrows) Pairs of peaks in which one is tRNA gene-associated and one ~6 kb away is not; the arrow is associated with the latter. Note that peaks for chromosome M (mtDNA) are all blue, indicating they do not reach statistical significance for enrichment. A Ty1 element is found in each case lying between the two peaks in the reference sequence. (Gray arrow) Insertions on Chrs IV and XV where there are no known Pol III transcripts. (Upper inset) Chr XVI Double Ty1 peak associated with one tRNA gene. (Middle inset) Same region after pre-existing reference Ty1 sequence was removed; note merging of peaks. See Supplemental Figure S1 for explanation of Chr XVI double peaks. (Insets) Small red tick marks are individual insertion positions. (Lower inset) Chr XIV, typical single tRNA peaks associated with two nearby tRNA genes in high resolution. Note how integration windows map to the 5′ side of tRNAs in all cases.


