
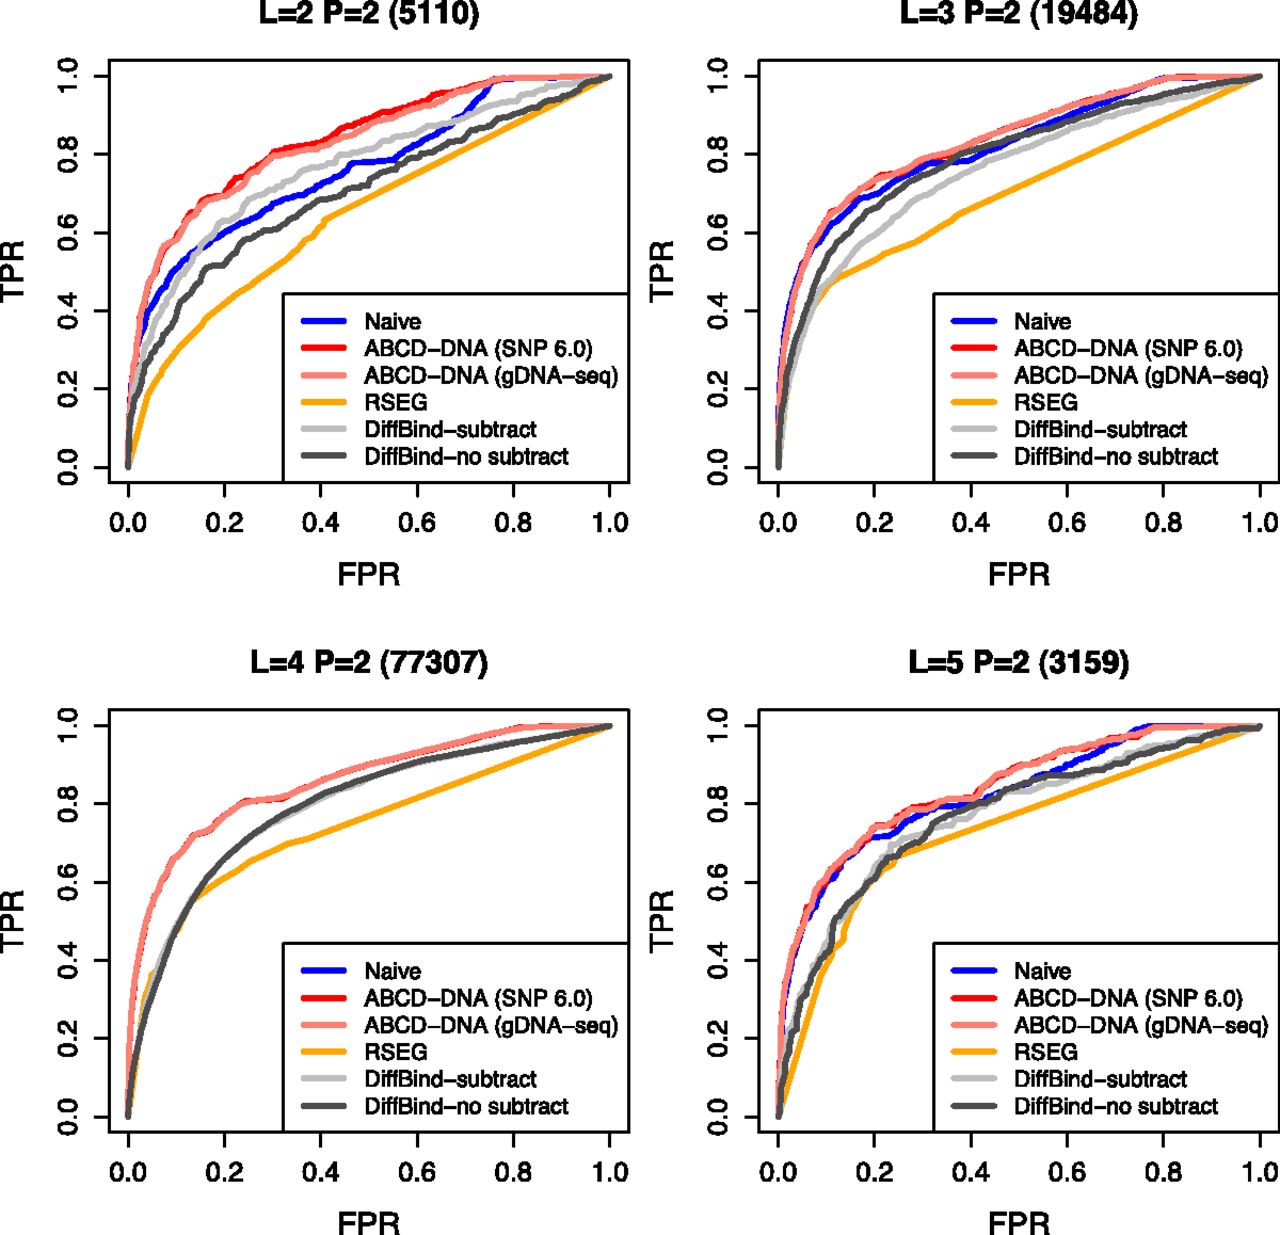
ABCD-DNA outperforms competing approaches. ROC curves (sensitivity versus 1 − specificity) are shown for various differential region detection algorithms operating on MBDCap-seq data, using 450k array data as an independent source of truly and nontruly differentially methylated regions. “Naive” uses offsets to account for (effective) sequencing depth but not CNV; “ABCD-DNA” uses either Affymetrix SNP 6.0 or genomic sequencing to estimate CNV offsets. “RSEG” denotes running rseg-diff with different sensitivity cutoffs. “DiffBind,” which operates on MACS-detected regions, was run both with and without input subtraction. Each panel shows ROC curves for the respective CNV stratum (between LNCaP and PrEC cells), as indicated in the panel title; the number of such regions is shown in parentheses. In the “L = 4 P = 2” panel, Naive and both ABCD-DNA curves almost completely overlap, as do the two DiffBind curves (with and without input subtraction).


