
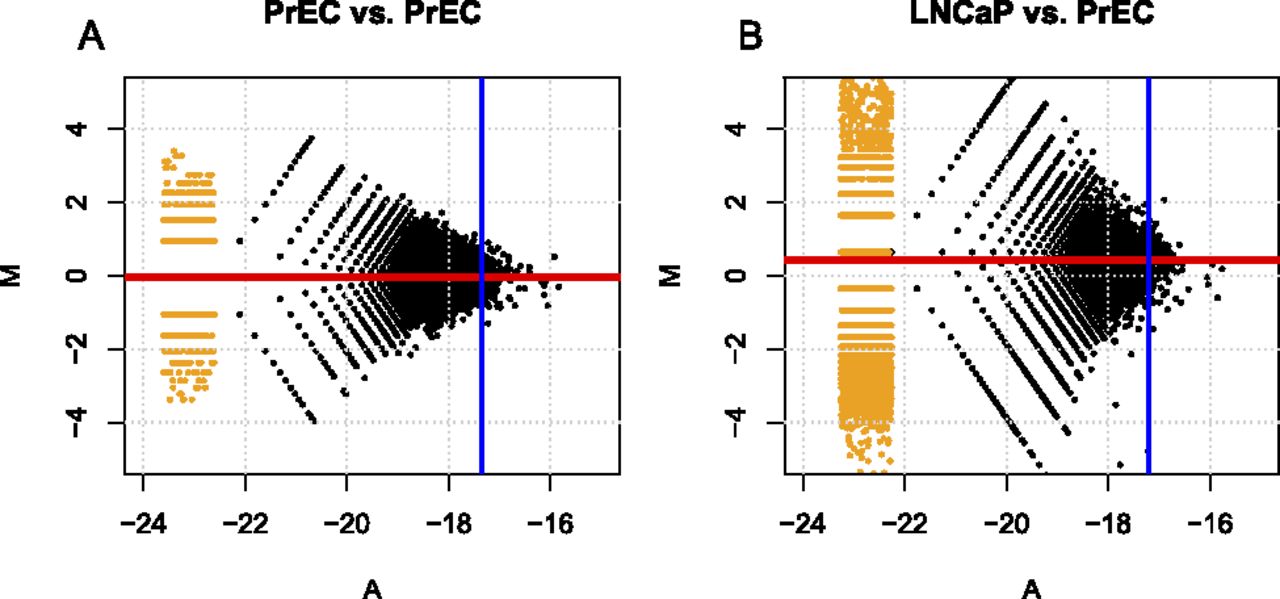
Figure 3.
Normalization to “neutral” CNV state using estimated scaling factors. M (depth-normalized log-fold-change) versus A (depth-normalized average-log) “smear” plots for MBDCap-seq data are shown between technical replicates (A) and between cancer and normal (B); each dot represents a 500-bp region of the genome. M is defined as the log-fold-change between two samples (counts divided by library size); A is the average of the log counts divided by library size. (Blue lines) 99th percentile of A-values; (red lines) scale factor estimates (median of M for regions with A greater than 99th percentile).


