
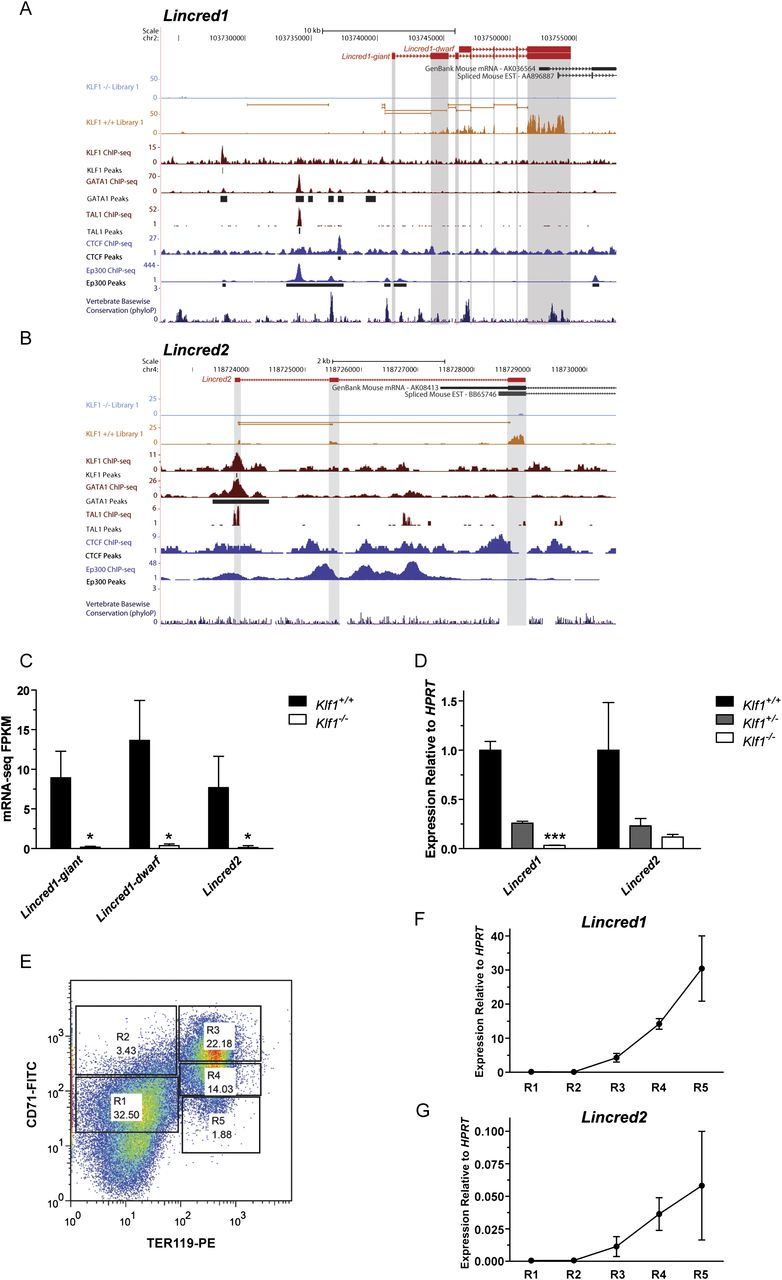
KLF1 regulates two novel erythroid-specific long noncoding RNAs (lncRNAs). (A) An image from the UCSC Genome Browser with tracks depicting a novel long intergenic noncoding RNA of erythroid differentiation defined as Lincred1. (Red) Erythroid RNAs present in this region as defined by Cufflinks. There appears to be two separate isoforms of the one gene; hence, they have been named “giant” and “dwarf” for the long and short isoforms, respectively. (Black) Mouse mRNAs and ESTs deposited into GenBank for this same region. Representative mRNA-seq tracks for a single Klf1−/− and Klf1+/+ are shown in light blue and orange, respectively (all mRNA-seq data are presented in Supplemental Fig. S6). ChIP-seq data for KLF1, GATA1, and TAL1 (maroon tracks), as well as CTCF and EP300 (dark blue tracks), from erythroid tissues are shown together with peak calls. (Bottom) A vertebrate conservation track (phyloP). Exons of the novel lncRNAs are highlighted by vertical gray bars. (B) An image from the UCSC Genome Browser for the novel erythroid lncRNA Lincred2. Tracks in the browser image are as described above for A. (C) Quantification of mRNA-seq data for Lincred1-giant, Lincred1-dwarf, and Lincred2 by the FPKM method. Each bar represents the mean FPKM for three independent biological replicates + 95% confidence interval. (*) Benjamini-Hochberg–corrected P < 0.05. (D) Expression validation by qRT-PCR using specific primers for Lincred1 and Lincred2. Each bar represents the mean + SEM for at least three independent biological replicates normalized to the housekeeping gene HPRT and to the Klf1+/+ expression level. (***) P < 0.001 by Student's t-test. Note that primers for Lincred1 amplify both the giant and dwarf isoforms. (E) Representative FACS plot for sorting E13.5 fetal liver cells into R1–R5 populations using the cell surface markers CD71 and TER119. Gates are shown together with the proportion of cells in each population. (F) Expression of Lincred1 throughout erythroid differentiation (R1–R5) as determined by qRT-PCR. Each point shown is the mean ± SEM for three independent biological replicates normalized to expression of the housekeeping gene HPRT. (G) Expression of Lincred2 throughout erythroid differentiation shown as above in F.


