
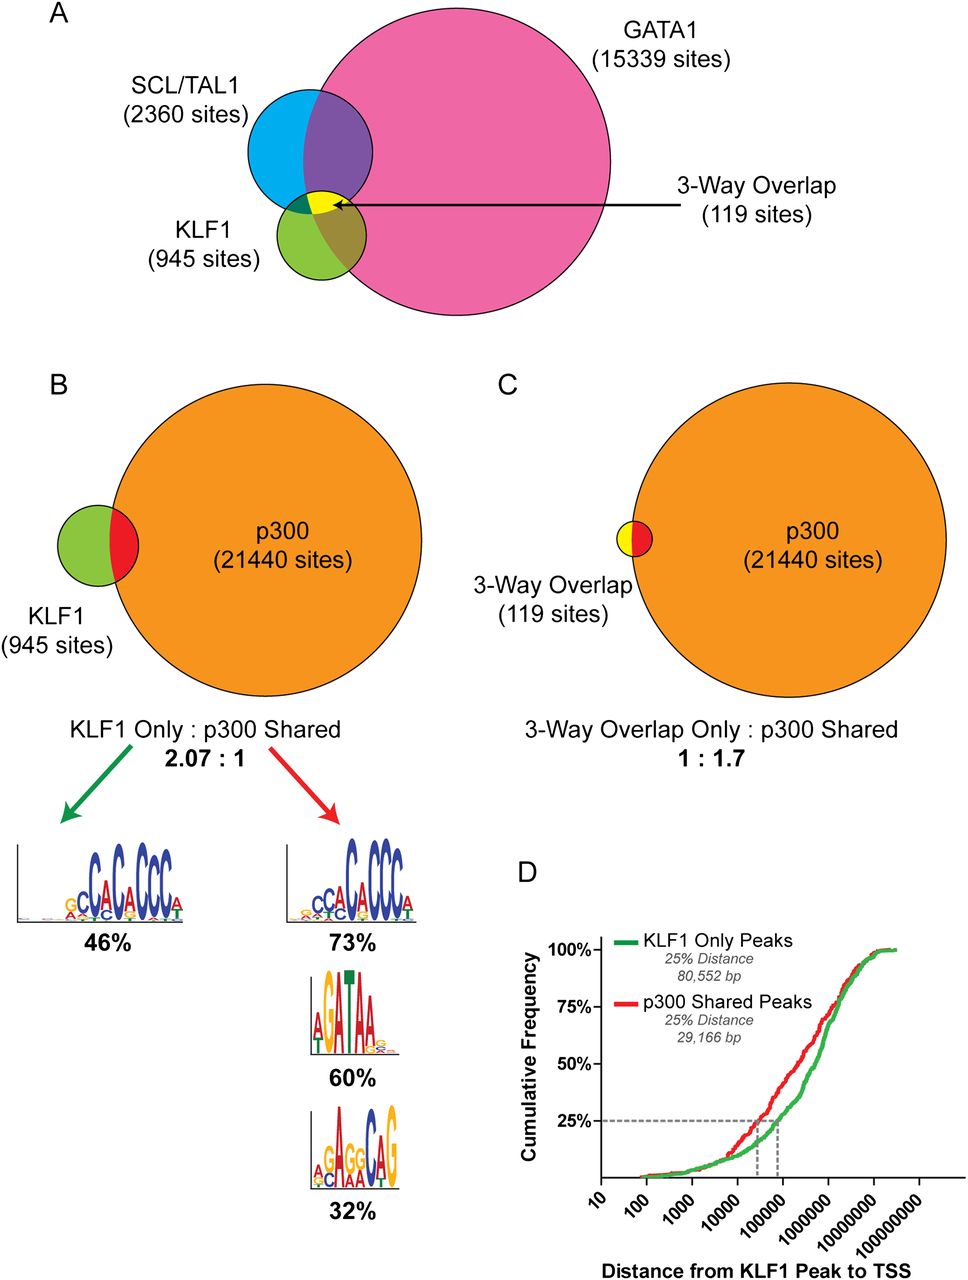
KLF1 works co-operatively with GATA1, TAL1, and EP300 to activate genes. (A) Venn diagram showing the overlap between in vivo binding of KLF1 (Tallack et al. 2010), GATA1 (Cheng et al. 2009), and TAL1 (Kassouf et al. 2010) from erythroid tissue ChIP-seq. (B) Venn diagram showing the overlap between in vivo binding of KLF1 (Tallack et al. 2010) and EP300 (Birney et al. 2007) from erythroid tissue ChIP-seq. KLF1 peaks were separated into two categories, KLF1 only and EP300 shared, as indicated, and subjected to motif enrichment analysis using MEME-ChIP. Significantly enriched motifs for each set are shown together with the percentage of peaks in that category containing the motif. (C) Venn diagram showing the overlap between three-way overlap peaks (KLF1-GATA1-TAL1, shown in A) and EP300 from erythroid tissue ChIP-seq. (D) Cumulative frequency distribution for the distances between KLF1 “activated” TSSs and either KLF1 only peaks (green line) or EP300 shared peaks (red line) as defined in B.


