
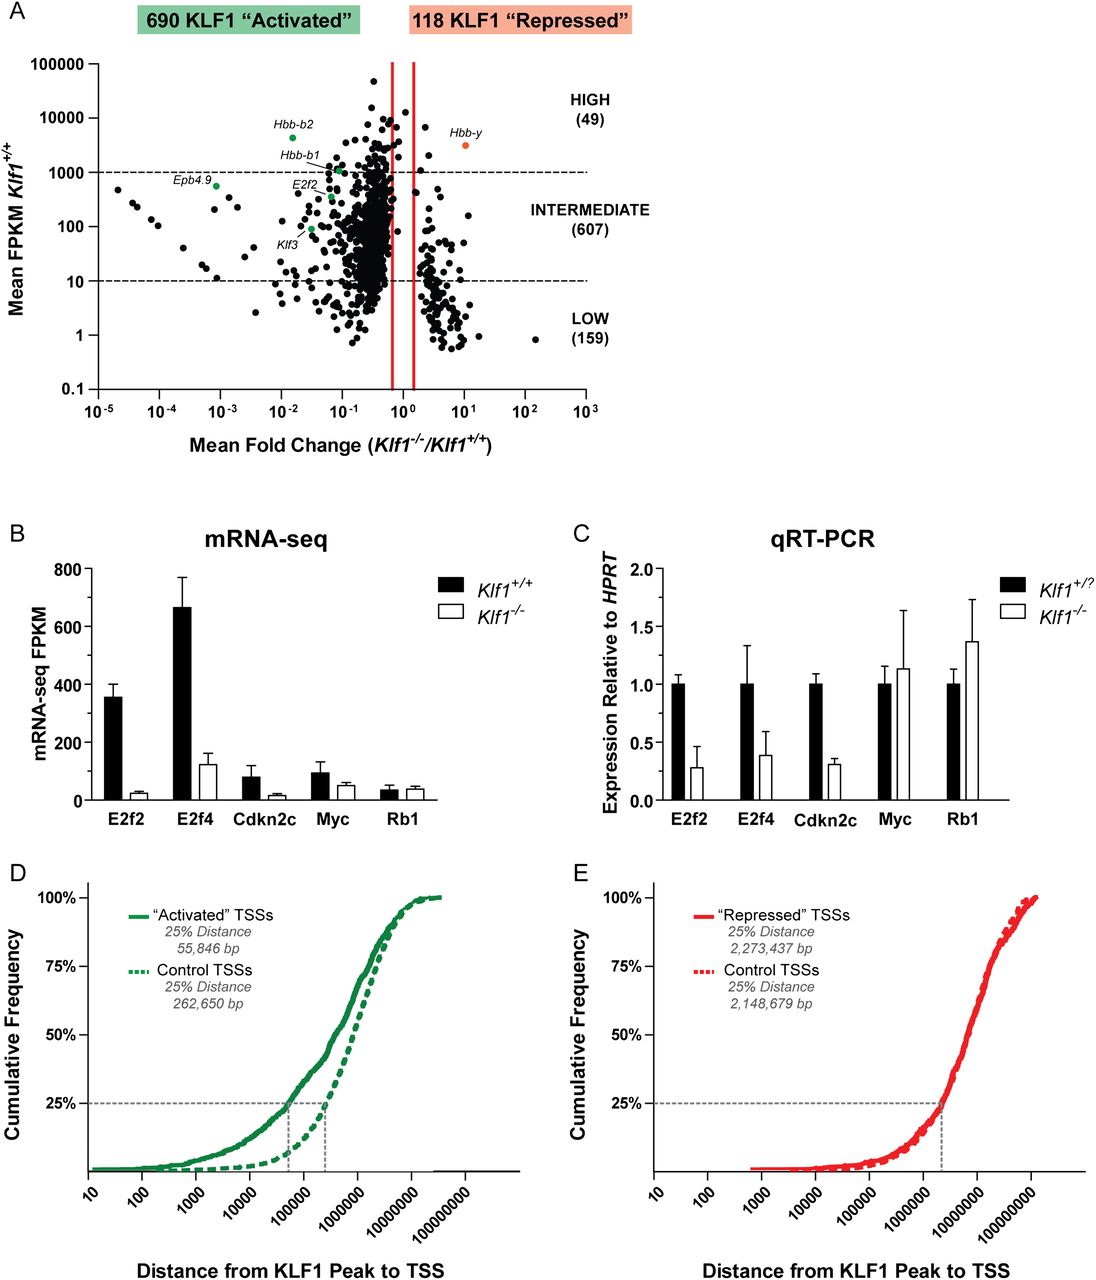
mRNA-seq reveals a comprehensive set of KLF1 activated genes. (A) A scatter plot representation of mRNA-seq expression data. Each data point represents a single RefSeq gene plotted according to the mean fold change between Klf1 genotypes (x-axis) and the mean Klf1+/+ expression (y-axis). The identity of several data points is indicated for reference. Vertical red lines indicate the 1.5-fold differential expression cutoff to define the KLF1 “activated” (decreased expression in Klf1−/− samples) and KLF1 “repressed” (increased expression in Klf1−/− samples). Genes were further sorted according to their mean Klf1+/+ expression into high, intermediate, and low expression categories. This data set is available as Supplemental Table S1. (B) mRNA-seq quantification by FPKM values. Each bar represents the mean FPKM + 95% confidence interval for three independent biological replicates. (C) qRT-PCR validation of mRNA-seq data. Each bar represents the mean + SEM for at least three independent biological replicates. Gene expression was normalized to the housekeeping gene HPRT and wild-type expression level. Klf1+/? is used to indicate that both Klf1+/+ and Klf1+/− samples were considered together. (D) Cumulative frequency distribution for the distances between KLF1 “activated” TSSs and KLF1 ChIP-seq peak locations (solid green line). The average distribution for 10 randomly simulated controls is also shown (dashed green line). (E) Cumulative frequency distribution for the distances between KLF1 “repressed” TSSs and KLF1 ChIP-seq peak locations (solid red line). The average distribution for 10 randomly simulated controls is also shown (dashed red line).


