
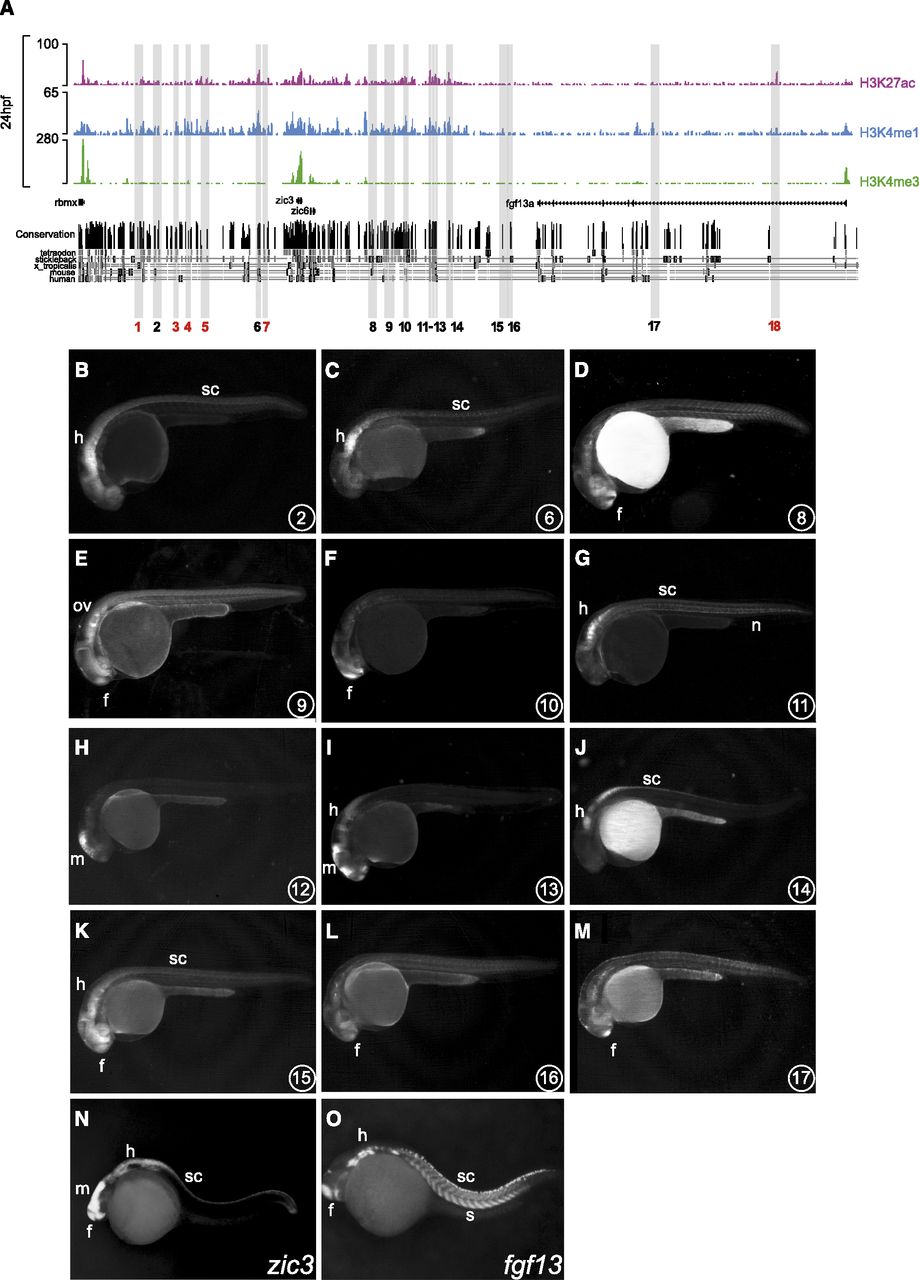
Enhancer activity of PDREs analyzed in stable (F1) zebrafish transgenic lines. (A) Distribution of H3K4me3, H3K4me1, and H3K27ac tracks along 500 kb spanning the zic3 locus at 24 hpf. Shaded in gray are 18 PDREs assayed for enhancer activity in zebrafish transgenic embryos. These PDREs show different degrees of evolutionary conservation as indicated by the conservation tracks below. Out of 18 tested regions, six regions did not exhibit enhancer activity (red numbers). (B–O) Lateral views of 24-hpf zebrafish embryos. (B–M) GFP expression driven by the PDREs indicated in the lower right corner of each panel. (N,O) Expression patterns of zic3 and fgf13a genes at the same stage. Forebrain (f); midbrain (m); hindbrain (h); otic vesicle (ov); spinal cord (sc), notochord (n) and somites (s).


