
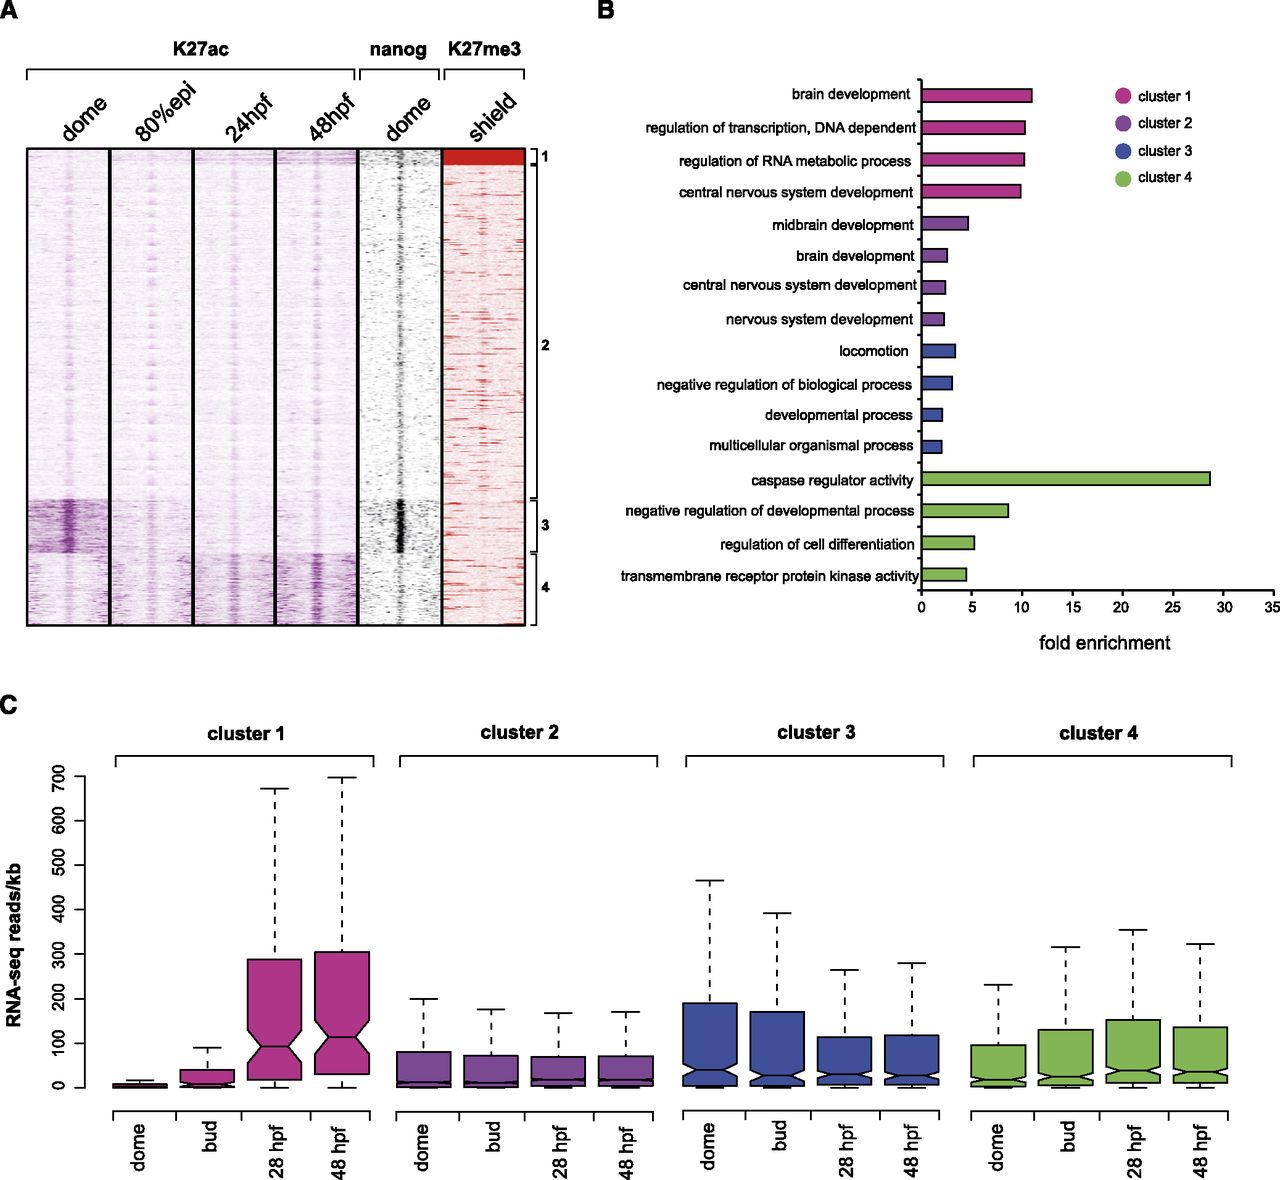
Clustering of H3K27ac, H3K27me3, and Nanog over poised (only H3K4me1-marked) enhancers at 80% epiboly. (A) K-means clustering (k = 4) identifies four groups of regulatory elements. The first group is enhancers marked by H3K27me3 that gain H3K27ac as the development proceeds. The second group corresponds to elements that remain poised during early development. The third and the fourth group correspond to elements that gain or lose H3K27ac, respectively. Zebrafish Nanog-like factor displays strong enrichment over early active (H3K27ac) enhancers. (B) GO analysis of nearest neighbor genes associated to each cluster. Only the four entries displaying highest enrichments are shown (P-value cut-off = 0.01). (C) Distribution of gene expression intensities (RNA-seq reads normalized for gene length) associated with each cluster. As previously shown, an overall positive correlation exists between expression intensity and enhancer H3K27ac levels.


