
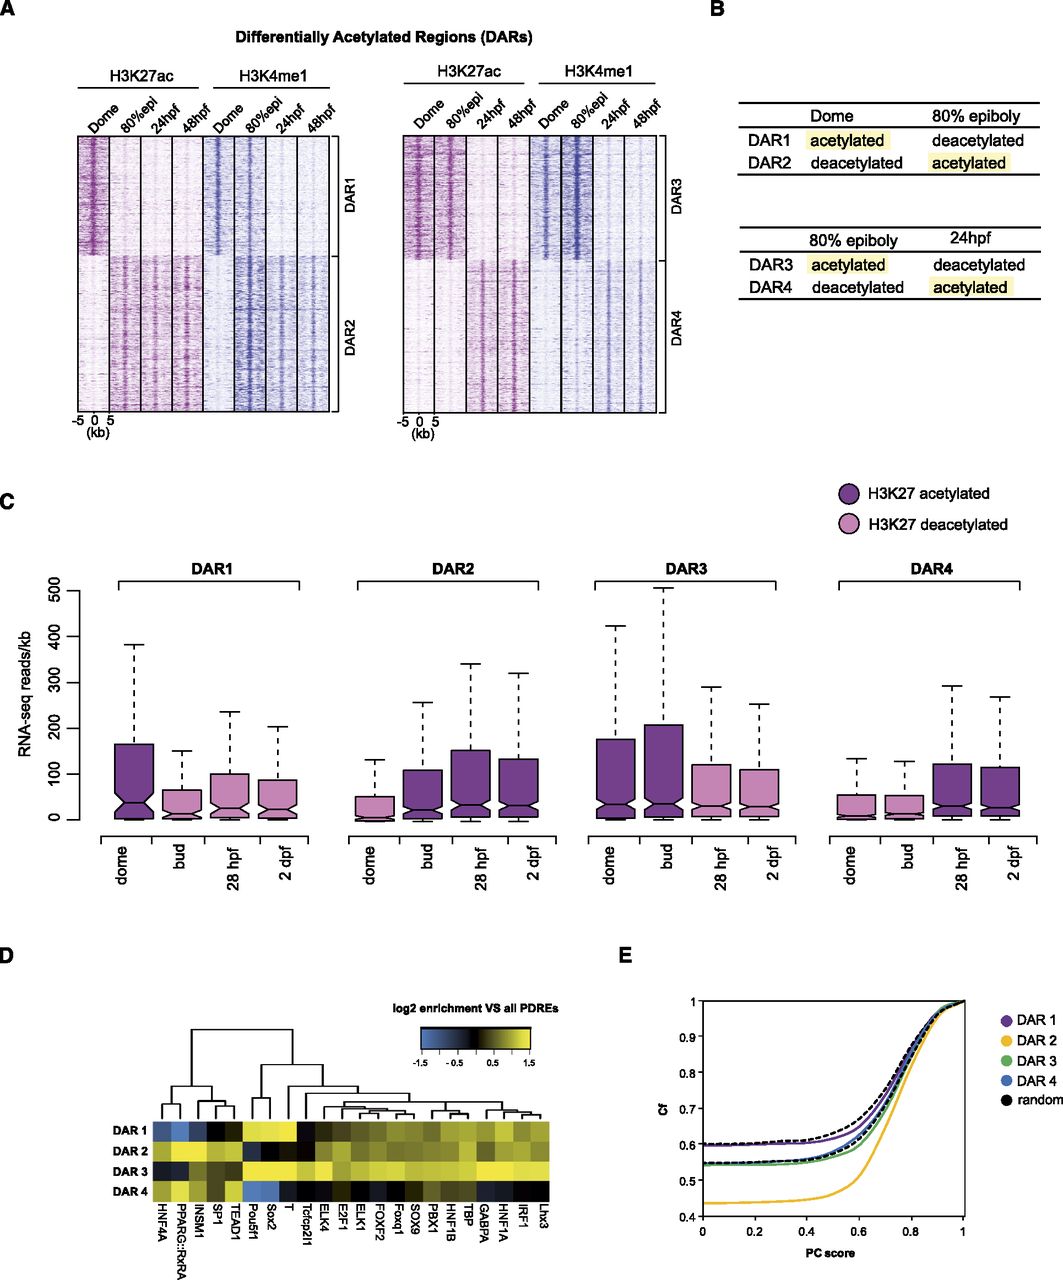
H3K27 differentially acetylated regions. (A) K-means clustering (k = 2) of regions differentially acetylated between subsequent developmental stages. The H3K4me1 mark follows the dynamics of H3K27ac; however, it disappears after H3K27ac has already disappeared (DAR1) (left panel). Similarly to regions differentially acetylated between dome and 80% epiboly, in later DARs, the H3K4me1 mark follows H3K27ac and even precedes H3K27ac on certain genomic locations (DAR4). (B) A schematic representation of different DARs; terms “acetylated” and “deacetylated” correspond to genomic locations identified by Fisher's exact test as differentially enriched for H3K27ac between two subsequent stages. (C) Distribution of gene expression intensities (RNA-seq reads normalized for gene length) displays an overall positive correlation with H3K27ac deposition on enhancer elements at all stages. The H3K27 acetylated DARs are found in the vicinity of highly expressed genes. (D) Hierarchical clustering of motif occurrence in differentially acetylated regions. The frequency of all JASPAR vertebrate motifs in the four DAR clusters was compared to the frequency in all PDREs. All motifs significantly overrepresented (P < 0.05, hypergeometric test in combination with Benjamini-Hochberg correction) in at least one DAR cluster were combined and clustered. (Yellow) Overrepresentation compared to all PDREs; (blue) underrepresentation. (E) Cumulative frequency (Cf) of DARs was plotted against average phastCons (PC) conservation scores that were calculated for each DAR. Each point on the graph represents the frequency of DARs with that of a lower PC score. The frequency of dome (−) 80% epi (+) DARs with a PC score 0 is 0.43, whereas that number is considerably higher (0.59) for dome (+) 80% epi (−) DARs, making them, therefore, less conserved. The black dotted lines correspond to the range of conservation of random DNA.


