
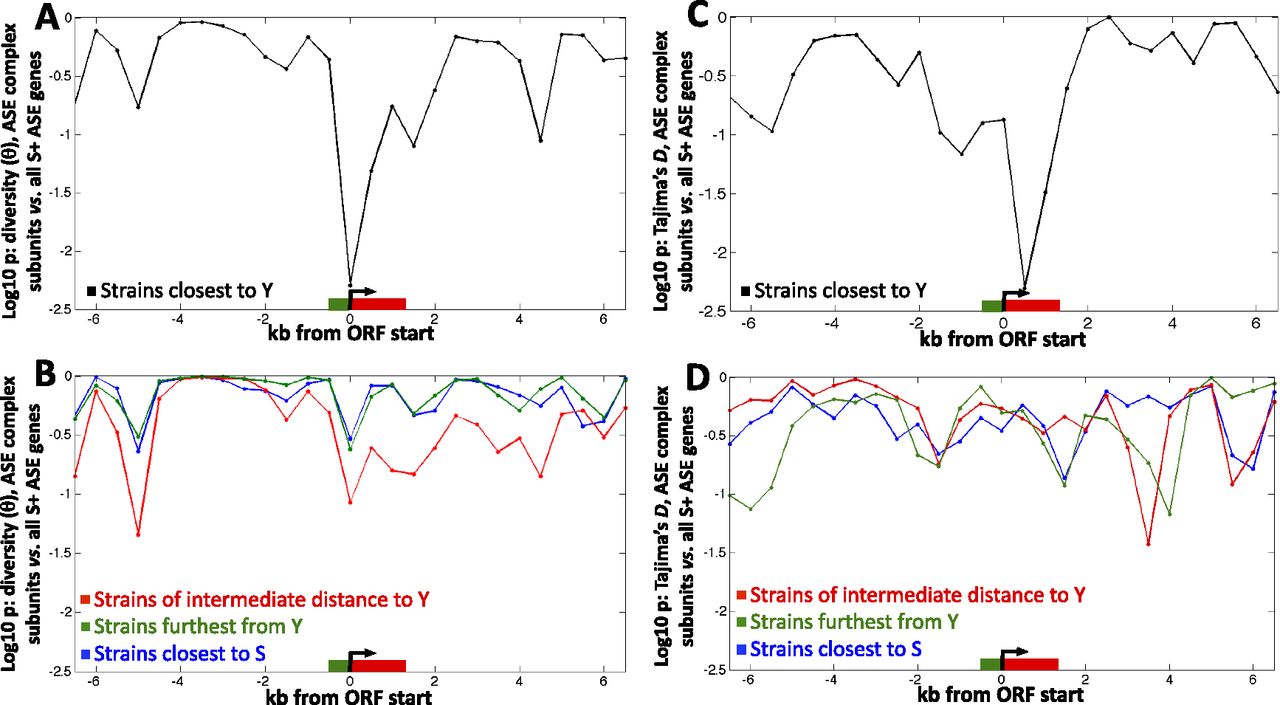
Population-genetic analysis. In all panels, patterns of genetic variation at the eight confirmed ASE genes are compared with the variation at all 971 genes showing ASE in the same direction. Variants are compared in a 1-kb moving window (500-bp step size), with all genes aligned by their 5′ ends and oriented in the same direction; the average ORF length is shown in red, and approximate promoter length is shown in green. Comparisons of either genetic diversity θ (A,B) or Tajima's D (C,D) are shown, with P-values computed using the nonparametric Wilcoxon test. The test is one-sided so that low P-values specifically indicate lower θ or D values among the eight ASE genes—as expected from a selective sweep—compared with the 971 control genes. Comparisons use either the 21 strains most closely related to Y (A,C), or one of three sets of 21 control strains (B,D): those most closely related to S (blue), those of intermediate distance to Y (red), or those of greatest distance to Y (green).


