
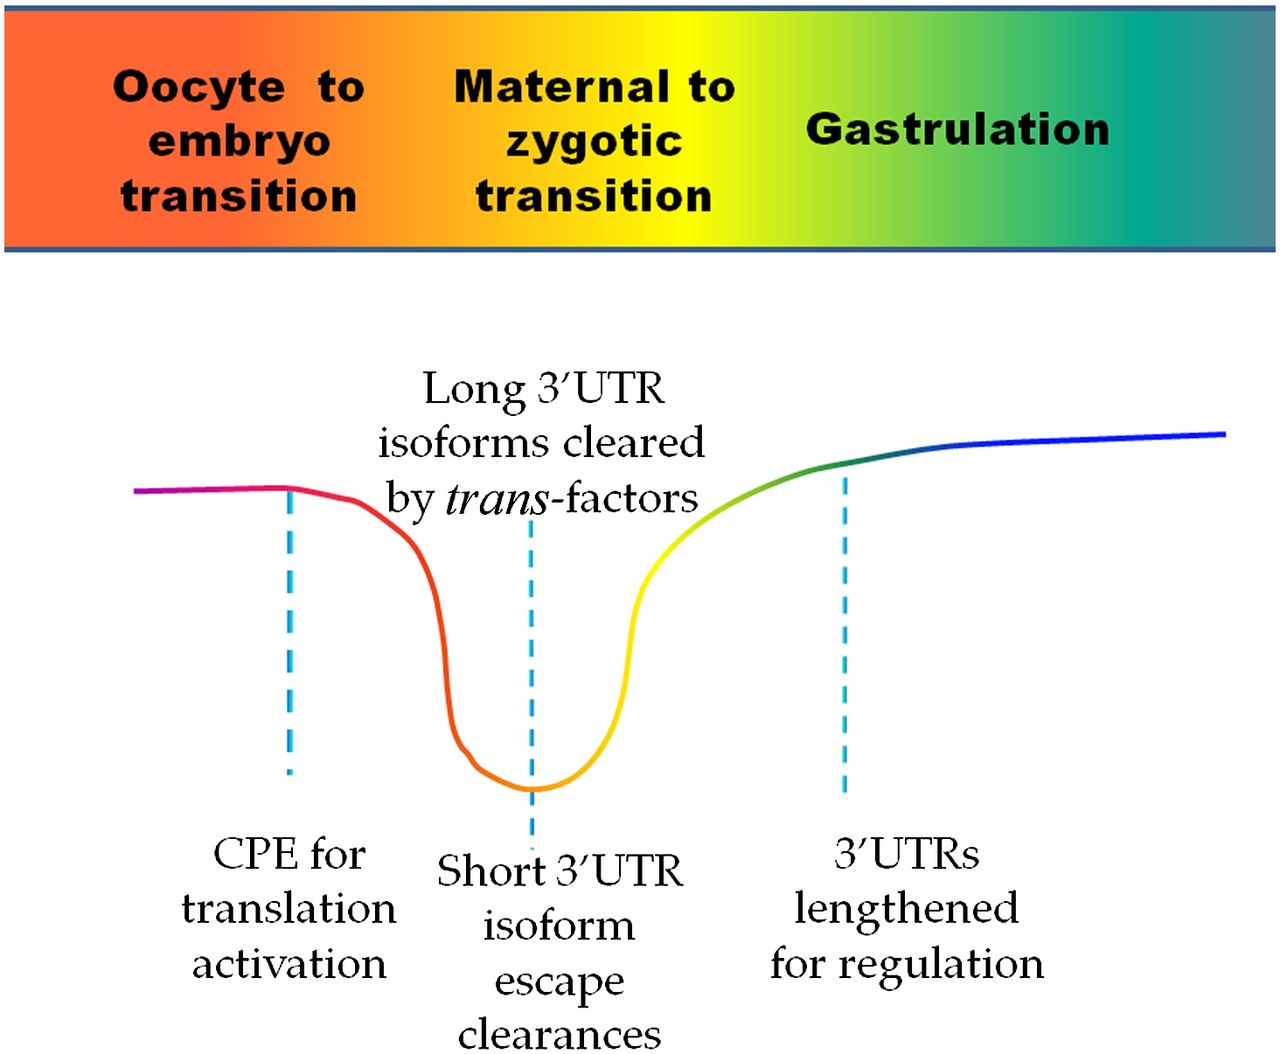
Figure 5.
Schematic graph of potential biological functions of 3′ UTR dynamics involved in early embryogenesis. See text for details.
(Downloading may take up to 30 seconds. If the slide opens in your browser, select File -> Save As to save it.)
Click on image to view larger version.
Schematic graph of potential biological functions of 3′ UTR dynamics involved in early embryogenesis. See text for details.
 CiteULike
 Delicious
 Digg
Digg Facebook
 Google+
 Reddit
 Twitter
