
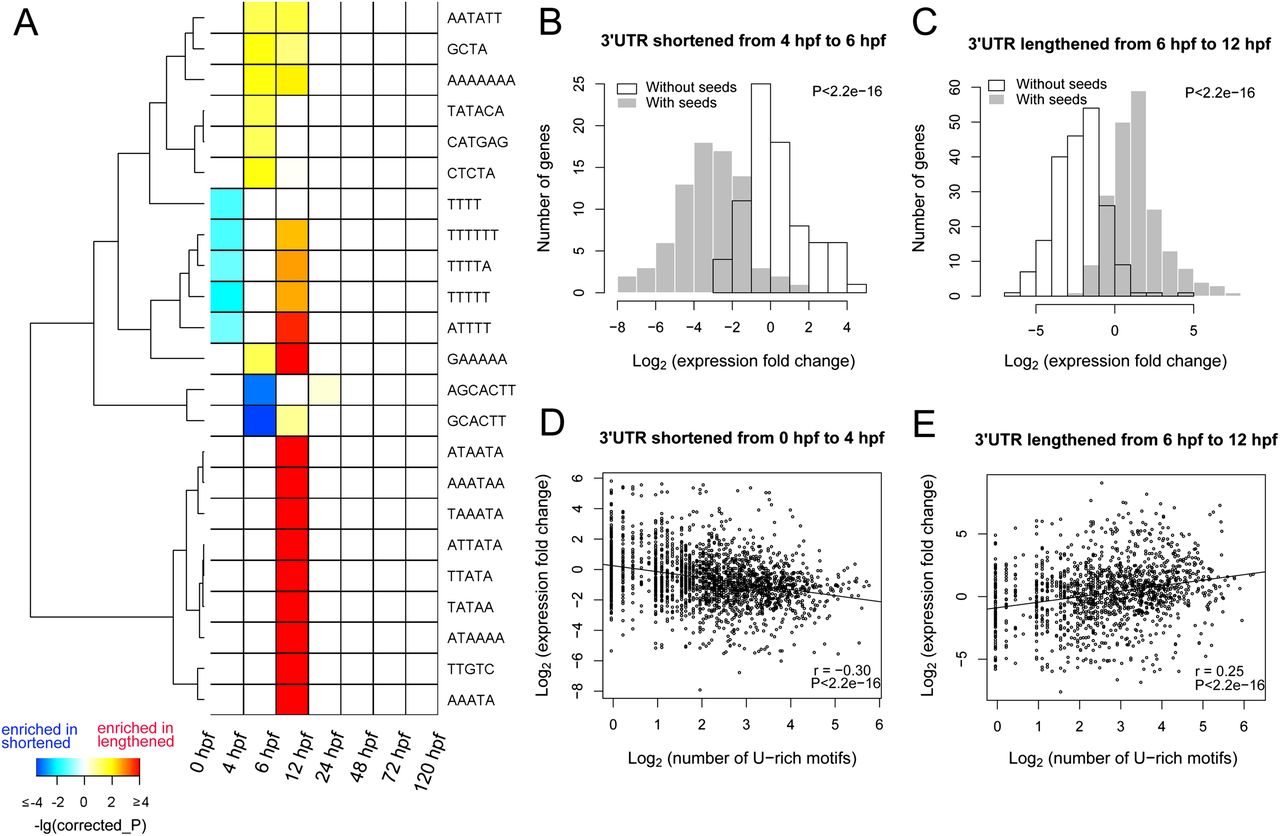
Developmental stage-specific motifs in extended 3′ UTRs. (A) Enrichment of motifs in extended 3′ UTRs by comparing 3′ UTR-lengthened genes with 3′ UTR-shortened genes between consecutive developmental time points. Motifs enriched in 3′ UTR-lengthened genes are assigned a positive P-value (hence, positive corrected P in the Bonferroni sense), whereas motifs enriched in 3′ UTR-shortened genes are given a negative P-value (hence, negative corrected P). Only motifs with corrected P-values less than 0.1 and ranked in the top 10 for a specific stage are shown. (B) Most 3′ UTR isoforms with the miR-430 seed GCACTT were down-regulated for genes with a shortened 3′ UTR from 4 to 6 hpf. The distributions of expression levels of 3′ UTR isoforms with and without miR-430 seed were compared by Kolmogorov-Smirnov test and the P-values are shown for both B and C. (C) Most 3′ UTR isoforms with the miR-430 seed GCACTT were up-regulated for genes with the 3′ UTR lengthened from 6 to 12 hpf. (D) Expression levels of 3′ UTR isoforms were negatively correlated with the number of U-rich motifs (UUUUU) for genes with the 3′ UTR shortened from 0 to 4 hpf. Pearson correlation coefficients (r) are shown for both D and E. (E) Expression levels of 3′ UTR isoforms were positively correlated with the number of U-rich motifs (UUUUU) for genes with the 3′ UTR lengthened from 6 to 12 hpf.


