
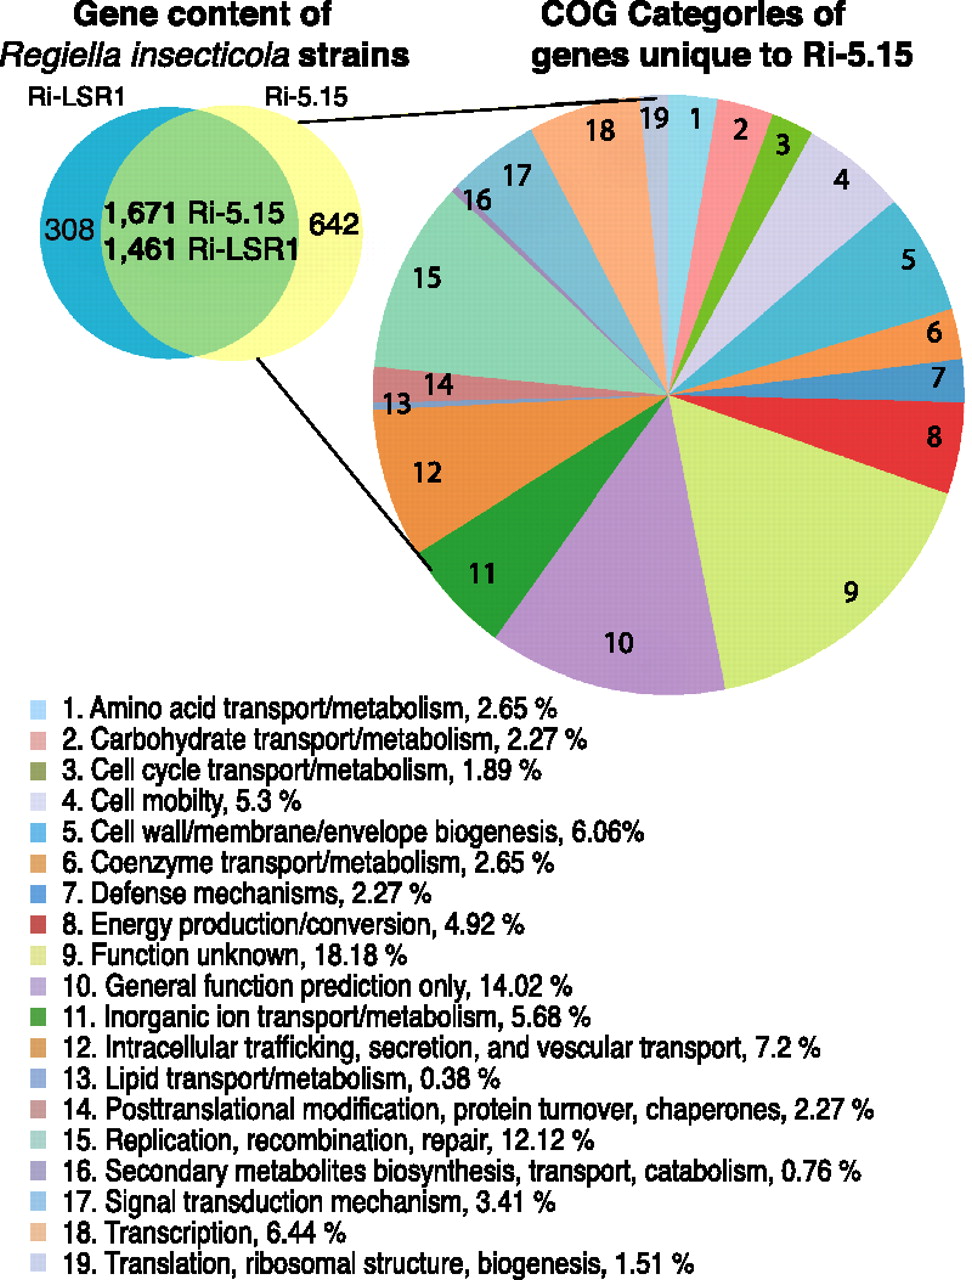
Figure 3.
Comparative genomics of R. insecticola LSR1 and R. insecticola 5.15. The left pie represents the number of genes homologous and unique to each R. insecticola strain. The right pie represents the relative proportion of novel R. insecticola 5.15 genes in 19 COG categories.


