
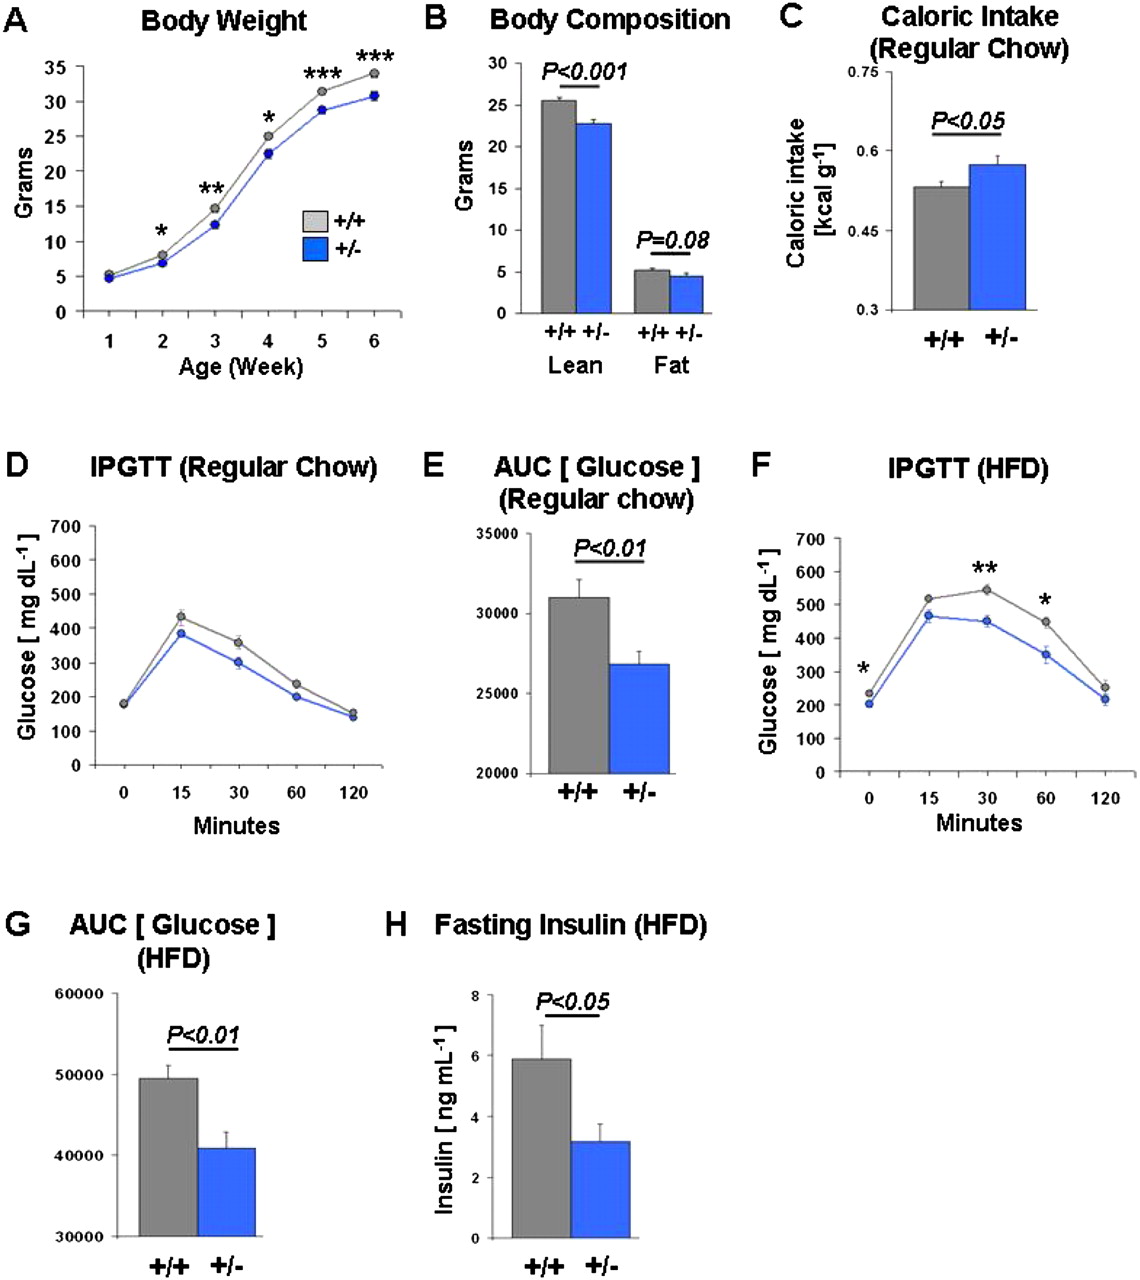
Characterization of Tcf7l2+/− mice. (A) Growth curves for wild-type (gray, n = 24) and heterozygous null (blue, n = 26) mice from 1 to 6 wk of age. (B) Lean and fat body mass in wild-type (+/+, n = 12) and heterozygous null (+/−, n = 13) mice. (C) Caloric intake in wild-type (+/+, n = 9) and heterozygous null (+/−, n = 10) mice. (D) Intraperitoneal glucose tolerance test (IPGTT) curves of wild-type (gray, n = 9) and heterozygous null (blue, n = 10) mice on a regular chow diet. (E) Area under the curve (AUC) of the IPGTT plot from D. (F) IPGTT curves of wild-type (gray, n = 11) and heterozygous null (blue, n = 12) mice after 10 wk on a high-fat diet (HFD). (G) Area under the curve (AUC) of the IPGTT plot from F. (H) Fasting plasma insulin levels in wild-type (+/+, n = 11) and heterozygous null mice (+/−, n = 12) after 10–12 wk on a HFD. (*) P < 0.05; (**) P < 0.01; (***) P < 0.001; (****) P < 0.0001.


