
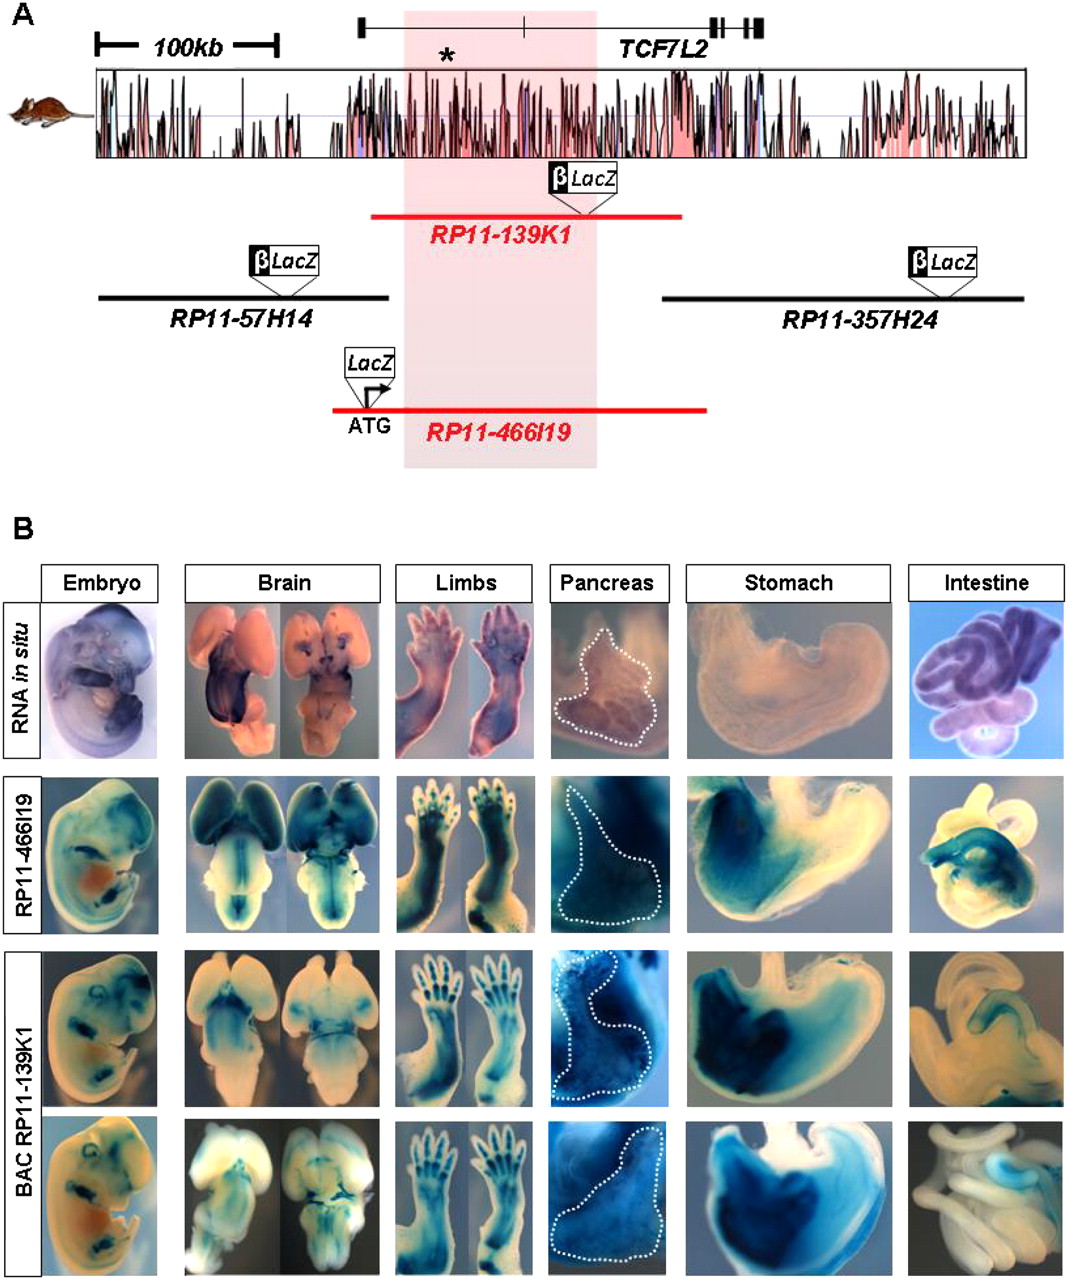
The regulatory landscape of TCF7L2. (A) The location of enhancer-trapping human BACs (RP11-57H14, RP11-466I19, RP11-139K1, and RP11-357H24) spanning 499.5 kb at the TCF7L2 locus. Noncoding sequence conservation between human and mouse is displayed as red peaks. The T2D-associated interval is highlighted in red. A black asterisk marks the location of SNP rs7903146. (B) The endogenous expression of Tcf7l2 is shown in the top row, while enhancer-trapped BAC RP11-466I19 and two independent BAC RP11-139K1 transgenic lines are shown in the middle and bottom rows, respectively. Whole-mount images at embryonic day 12.5 (E12.5) are shown in the first column. Images of brain (dorsal and ventral views), limb (fore- and hindlimbs), pancreas (outlined with dotted white line), stomach, and intestine at E15.5 are shown in the adjacent columns (left to right). Enhancer-trapped BACs RP11-466I19 and RP11-139K1 show overlap with endogenous Tcf7l2 expression. Enhancer activity is present in the brain, fore- and hindlimbs, pancreas, pyloric stomach, and lower gastrointestinal tract.


