
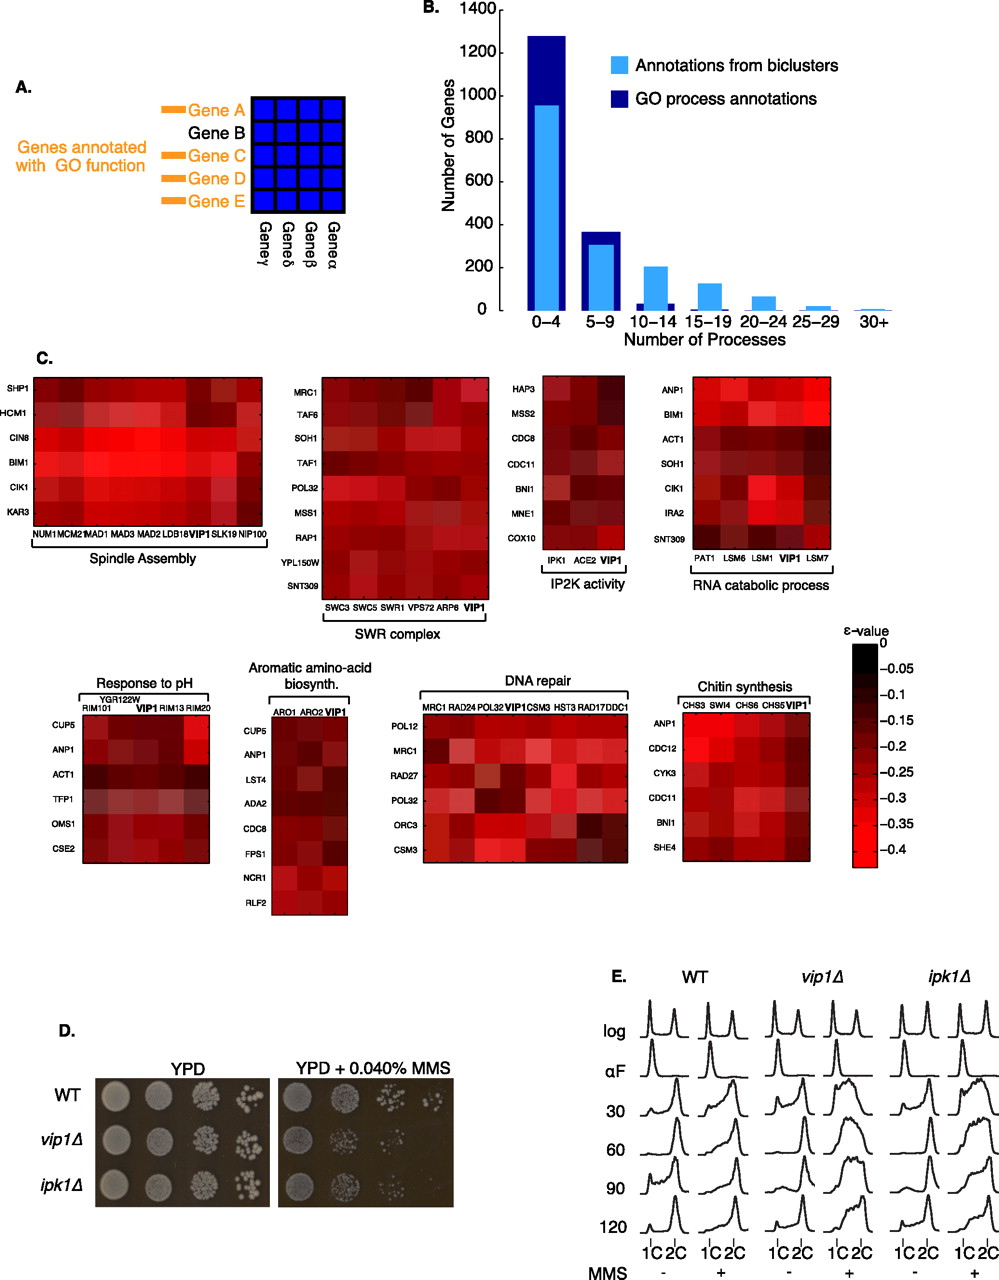
(A) Functional enrichment for each gene is derived from significant functional enrichments of other genes that appear in the same biclusters (see Methods for details). (B) A histogram of the number of processes associated with each gene as determined by the distinct functional enrichments of the biclusters of which that gene is a member (light blue) and the number of GO annotations currently given to that gene (dark blue). (C) Some example biclusters that contain the gene VIP1. VIP1 only has one GO annotation, but appears in a variety of highly enriched functional contexts. (D) vip1Δ and ipk1Δ exhibit reduced viability in the presence of MMS. Serial 10-fold dilutions of vip1Δ and ipk1Δ were spotted onto YPD or YPD + 0.040% MMS and incubated at 30°C for 3 d. (E) vip1Δ and ipk1Δ exhibit DNA replication defects in the presence of MMS. Cells were arrested in G1 and released synchronously into the cell cycle in either the presence or absence of 0.035% MMS. Histograms represent the cell cycle distribution after release from G1 arrest ± MMS for the specified times. Positions of cells with 1C and 2C DNA contents are indicated.


