
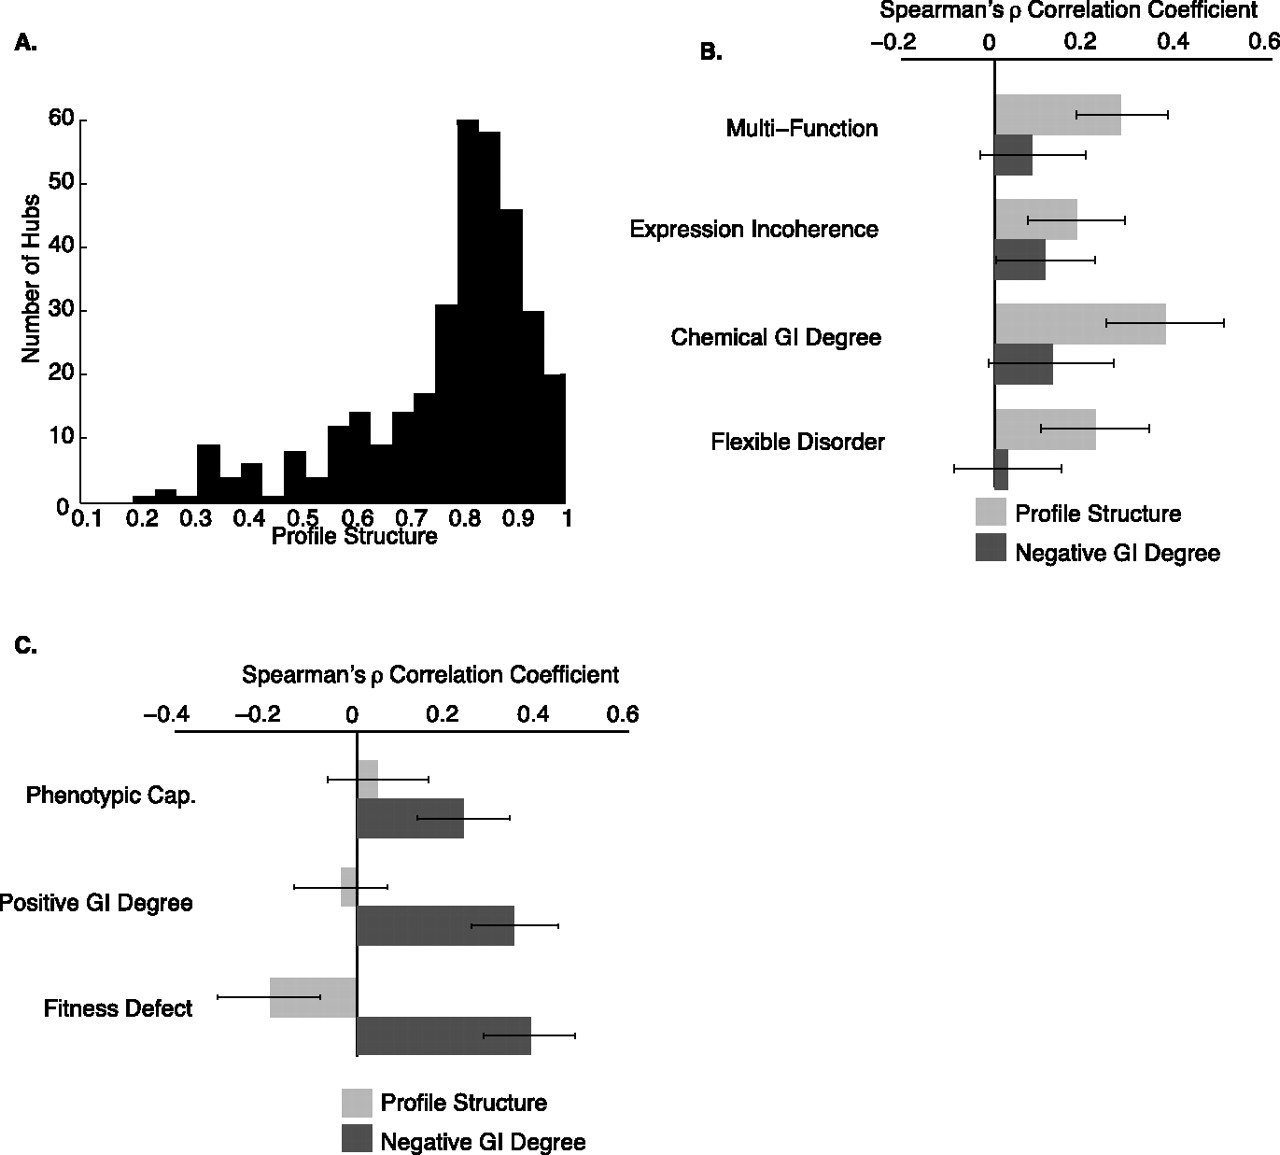
Figure 3.
(A) A histogram of profile structure among hubs. (B) The Spearman correlation coefficients of profile structure and negative GI degree against gene properties that are better correlated with profile structure than degree. Error bars represent 95% confidence intervals and were derived through bootstrapping. (C) The Spearman correlation coefficients of profile structure and negative GI degree against gene properties better correlated with negative GI degree than profile structure. Error bars represent 95% confidence intervals and were derived through bootstrapping.


