
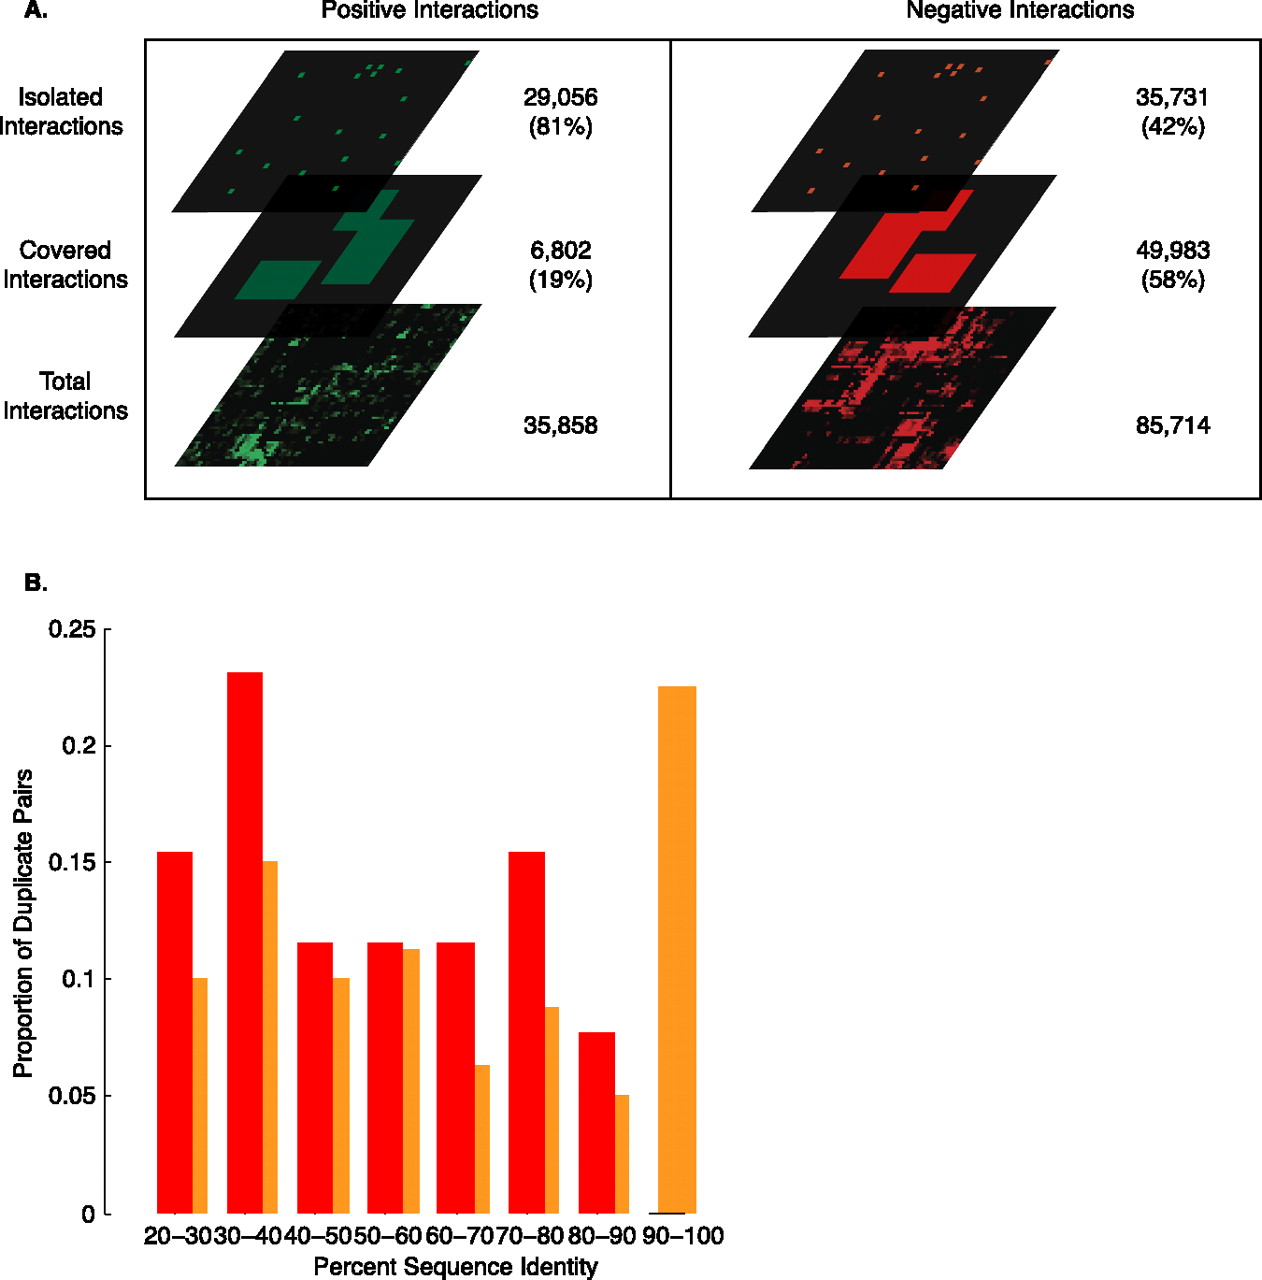
Figure 2.
(A) The coverage of genetic interactions by XMOD biclusters. The interactions are divided into “covered” interactions that occur within a bicluster and “isolated” interactions that occur outside of a bicluster. Fifty-eight percent of negative interactions are covered compared to only 19% of positive interactions. (B) A plot of the proportion of negatively interacting duplicate pairs [either “isolated” (orange) or “covered” (red)] against the amino acid sequence identity of the duplicate pair.


