
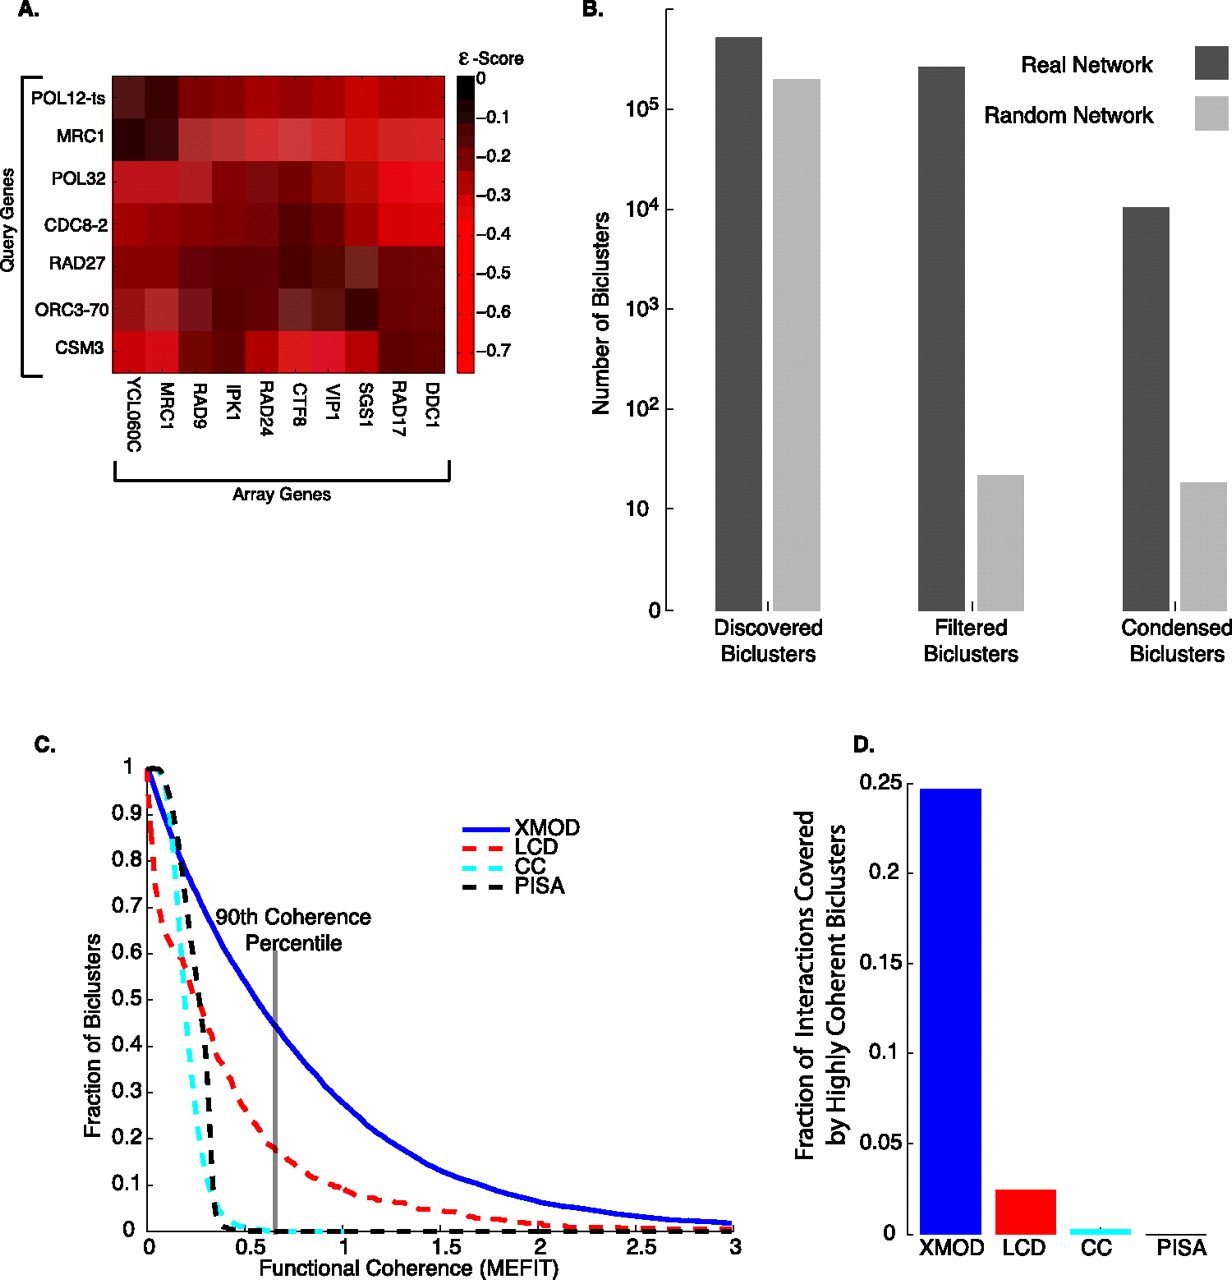
(A) A bicluster from the SGA genetic interaction network—an enrichment for (negative) genetic interactions between a set of query genes and a set of array genes. This bicluster was found by combining XMOD biclusters using MCL (see Methods). (B) A comparison of biclusters found on the real SGA network and the average number of biclusters found on randomized networks. While a significant number of biclusters are found on the random networks (Discovered Biclusters), statistical filtering leaves, on average, 20 random biclusters versus ∼200,000 real biclusters (Filtered Biclusters). After controlling for redundancy, there were ∼10,000 real biclusters (Condensed Biclusters) but again only ∼20 random biclusters on average. (C) A plot of the proportion of biclusters that meet or exceed a given functional relatedness score. XMOD condensed blocks is solid blue, LCD (Pu et al. 2008) is dashed red, CC (Cheng and Church 2000) is dashed cyan, and PISA (Ihmels et al. 2002; Kloster et al. 2005) is dashed black. We also compare the methods after removing overlapping clusters from all methods in Supplemental Figure S7. (D) The percentage of interactions covered by biclusters whose functional relatedness score was in the top 90th percentile of the MEFIT network [the line is marked in (C)].


