
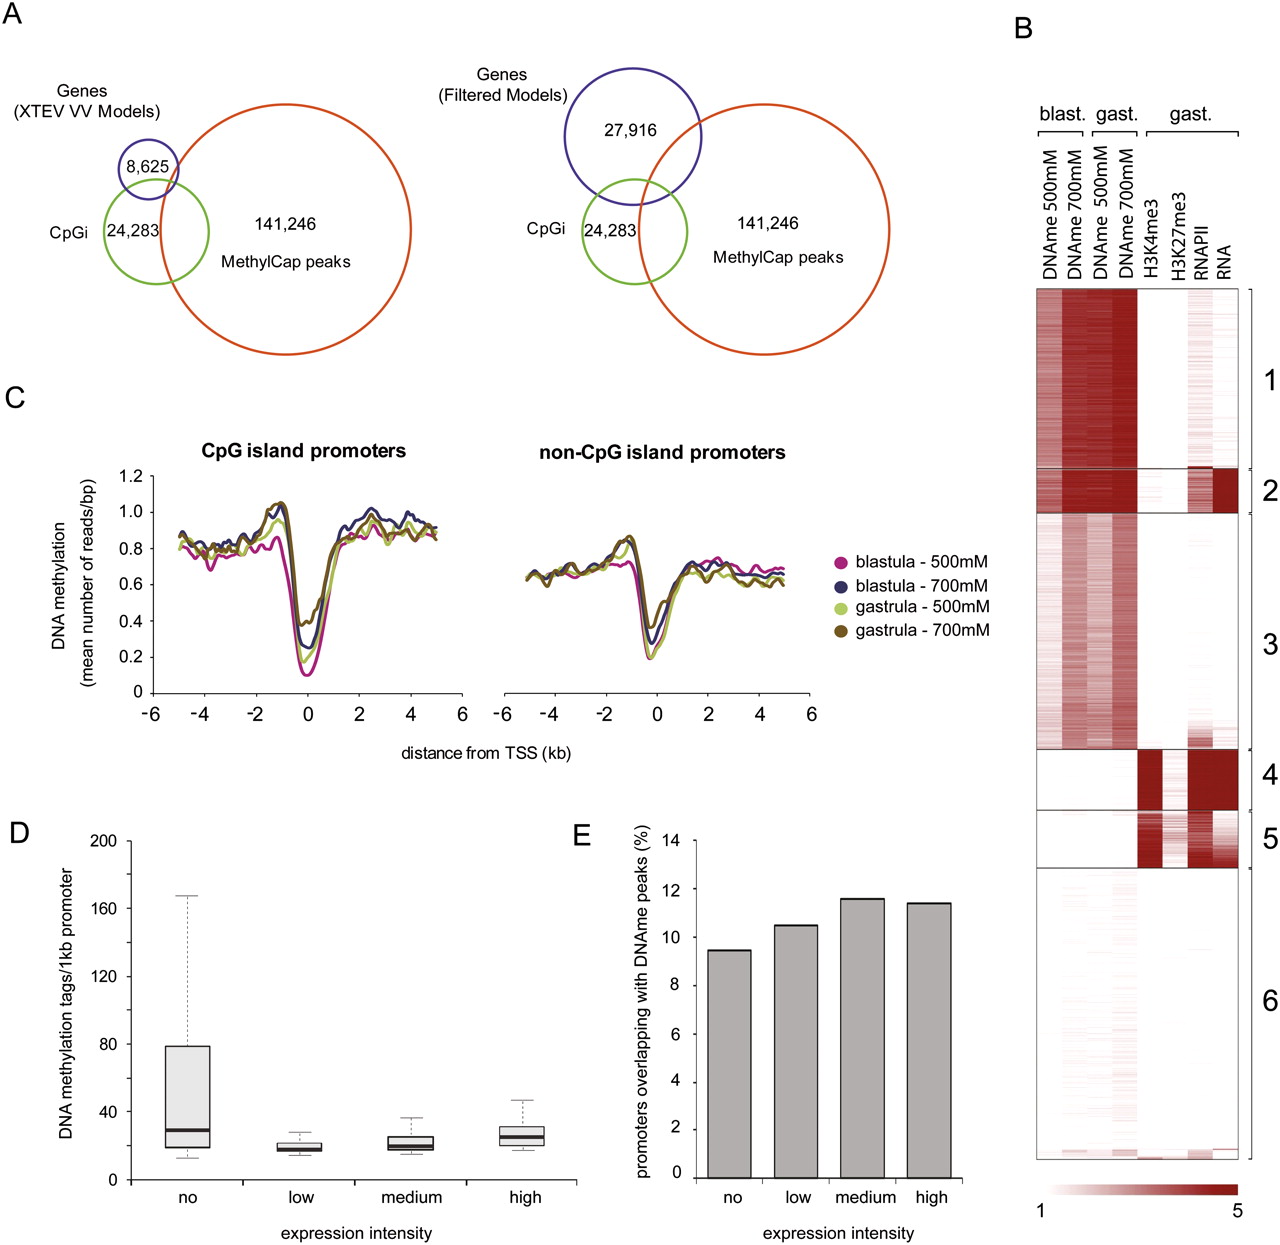
DNA methylation and transcriptional regulation. (A) Venn diagrams showing a direct overlap of merged DNA methylation peaks (141,246 regions, all four peak sets combined), the 5′ ends of genes (left: 8625 XTEV_VV gene models; right: 27,916 Joint Genome Institute, JGI, FilteredModels), and genomic CpGis (24,283 Takai-Jones CpGis). DNA methylation is largely absent from 5′ ends of genes. A large portion of the genomic CpGis are methylated (overlap between CpGis and MethylCap peaks). (B) K-means clustering of DNA methylation, histone methylation, and active transcription within CpGis. Clusters 1 and 3 correspond to methylated CpGis with different methylation profiles. Cluster 2 represents exons of genes expressed during gastrulation. Clusters 4 and 5 consist of active CpGi promoters. Cluster 6 corresponds to CpGis that are neither associated with active transcription units nor enriched for either histone modification or RNAPII. (C) Distribution of DNA methylation over CpG and non-CpGi promoters. Both CpG and non-CpG promoters show a dip in DNA methylation around the TSS. To define CpGi and non-CpGi promoter subsets, the TSS regions of XTEV_VV gene models were intersected with Takai-Jones CpGis. (D) Boxplots showing the abundance of DNA methylation within promoter regions of genes with distinct expression intensities. (E) Percentage of promoters (region 1 kb upstream of TSS) overlapping (≥500 bp) with peaks of DNA methylation.


