
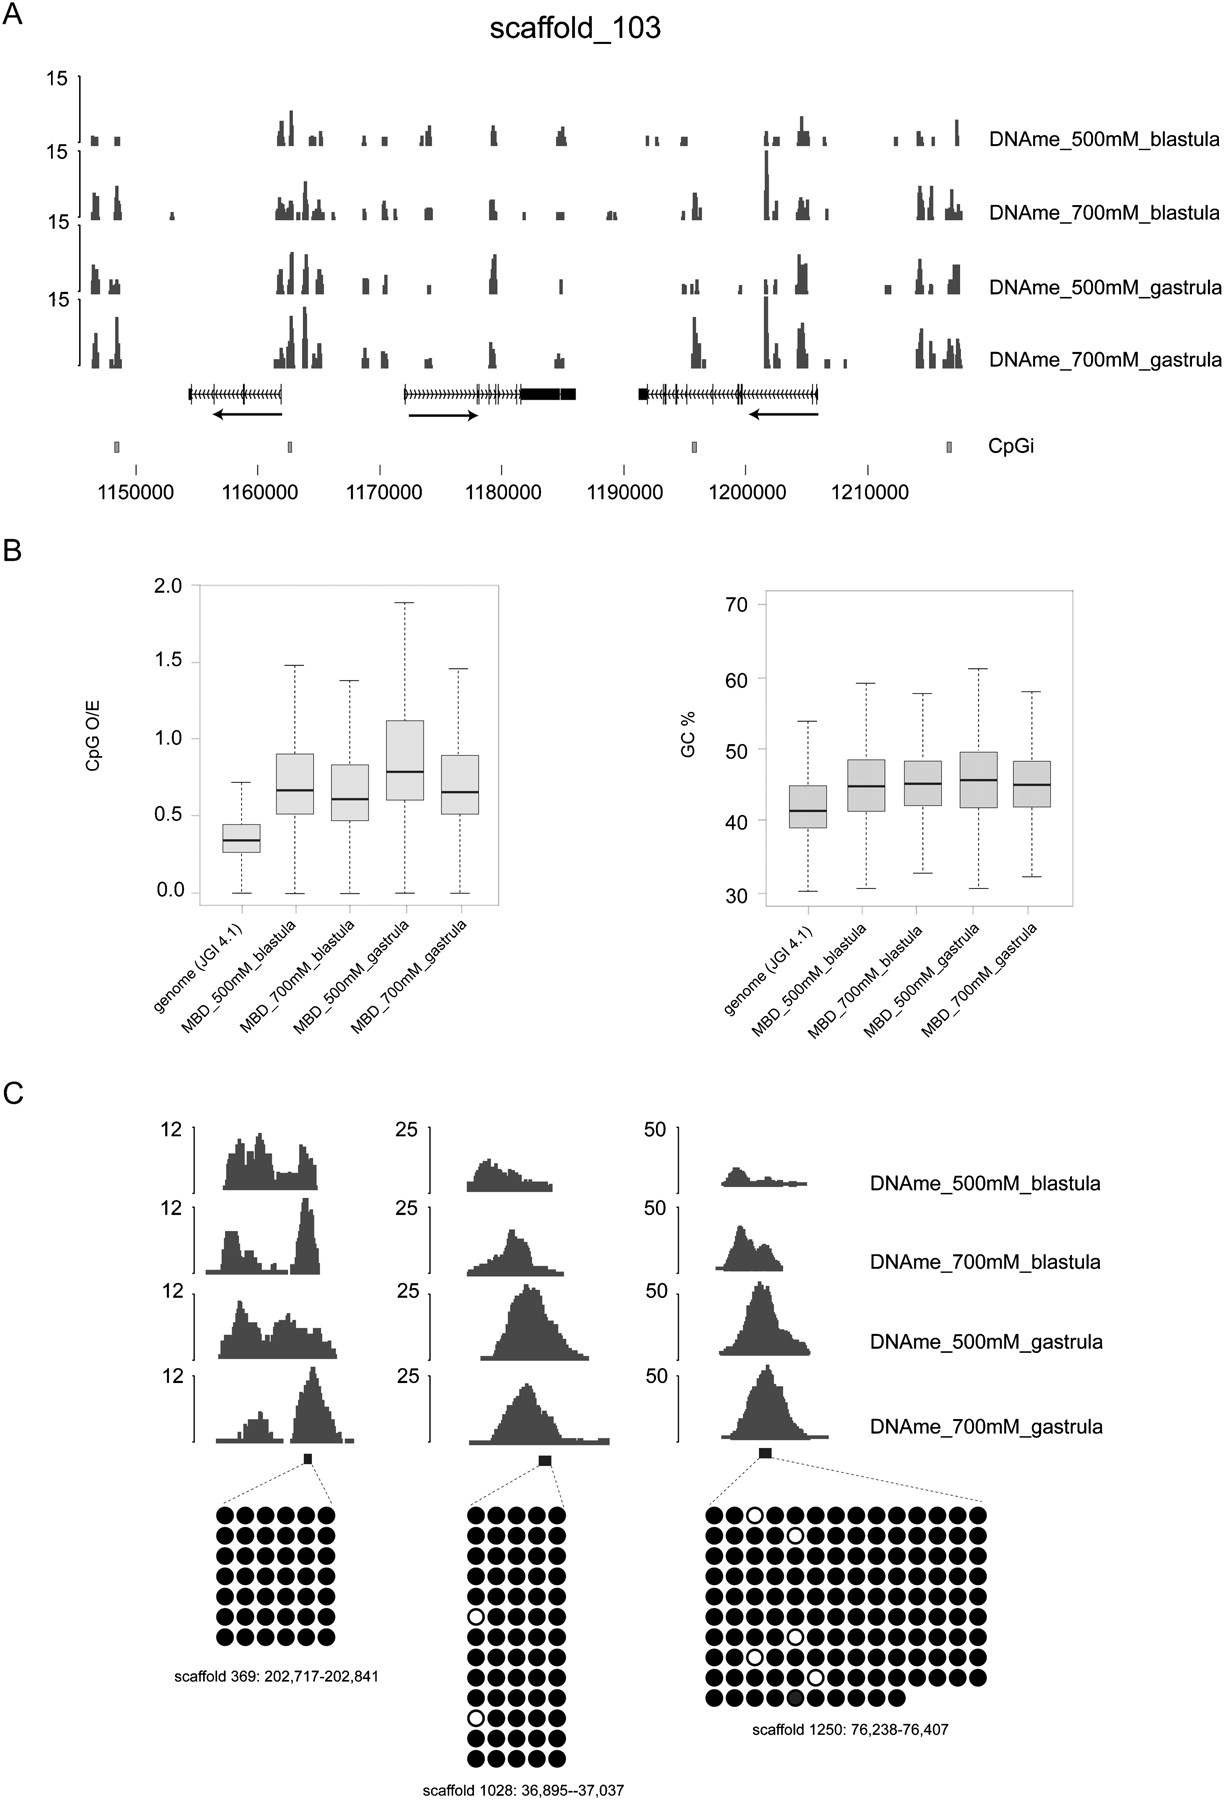
(A) Genome Browser view of sequenced DNA methylation tracks: late blastula (stage 9) and late gastrula (stage 12.5) tracks of both salt elutions (500 mM and 600 mM/700 mM). The X. tropicalis genome is robustly methylated in both intergenic and intragenic regions during blastula and gastrula stages. (B) Boxplots showing the distribution of the CpG observed/expected ratio (CpG O/E) and the GC content (GC%) of DNA methylation peaks. Peaks of DNA methylation are enriched for CpG dinucleotides, whereas their GC content is similar to the genome average. JGI 4.1 refers to the genome assembly used (Joint Genome Institute genome assembly version 4.1). (C) Bisulfite sequencing of randomly selected MethylCap peaks (see also Supplemental Fig. S2B). (Right) Embryonic stages and MethylCap salt elutions of the DNA methylation tracks; (black boxes) PCR amplicons; (below) bisulfite sequencing profiles of the amplicons. (Black circles) Methylated CpGs; (white circles) unmethylated ones.


